Thursday, September 23, 2021

THE Surf Report


Turn and face the strange. Ch-ch-changes!

SURF:


Days are getting shorter. Mornings are a little crisper. NW swells have suddenly appeared. Fullsuits are the norm. And birds are headed S for the season. Notice the ch-ch-changes? (With apologies to Bowie). Fall is officially here. For tomorrow into the weekend, we've got some late season SW showing up and early season NW. 


Look for new small NW/SW combo tomorrow for waist high surf and chest high sets at the best combo spots. That lasts into Saturday. 


For Sunday, we have slightly better SW showing up for waist to chest high surf. Nothing major this weekend but we'll at least have waves around town. And here's the tides, sun, and water temps for the next few days:
  • Sunrise and sunset:
    • 6:40 AM sunrise
    • 6:40 PM sunset
  • Water temps are hovering in the mid-60's and fullsuits will be the norm until June unfortunately.
  • And tides are pretty simple this weekend:
    • 2' at sunrise
    • 5' at lunch
    • 1.5' at sunset
FORECAST:

Let's get the easy stuff out of the way: Nothing from the tropics. Again. And there probably won't be until next summer since La Nina is in control. 


On the bright side, we've got fun leftover SW in the water on Monday along with a new fun NW. Look for chest high combo swell with the best spots hitting shoulder high. 


We then get a reinforcement from a better NW late Tuesday for shoulder high waves in SD that spills into Wednesday. 


Late next week is on the smaller side but we will still have rideable combo swell in the line ups. 


And if the models are correct, we could have a good late season SW arriving around the 10th for shoulder high surf around here and overhead sets in the OC. Hoping to flip on the EBS again...

WEATHER:


Nothing exciting on the weather front this weekend which is fine by me- don't need any Santa Anas adding fuel to the fires. 


And for you fans of snowboarding, the Northern Rockies got snow last week- actually, the last day of summer. So you got that going for you. For us down here, we've got a weak low pressure system setting up shop this weekend for more low clouds and cooler temps. That will exit after the weekend but look for the cooler temps and night/morning low clouds to stick around next week. If anything changes between now and then, make sure to follow North County Surf on Twitter!

BEST BET:

Monday with fun combo swells or Tuesday/Wednesday with fun NW! 

NEWS OF THE WEEK:


In its simplest form, surf comes from storms. And most likely, low pressure systems- like the ones that form in the Aleutians, off Antarctica, or those pesky hurricanes near Baja. But when we say 'low pressure', just what are meteorologists referring to? Here's a rundown from our friends at Accuweather:

There are quite a number of scientific terms commonly used in weather forecasting and low pressure is one of the most widely used terms. However, many people may not be exactly sure of what a low pressure area is.

Quite simply, a low pressure area is a storm. Hurricanes and large-scale rain and snow events (blizzards and nor'easters) in the winter are examples of storms. Thunderstorms, including tornadoes, are examples of small-scale low pressure areas.


On a weather map, low pressure areas are label with an "L" and high pressure areas are labeled with an "H." A low pressure area usually begins to form as air from two regions collides and is forced upward. The rising air creates a giant vacuum effect. Hence, a zone of low pressure is produced with the lowest pressure near the center of the storm. As a storm approaches a particular area, the barometric pressure will lower. In some sensitive people, body aches may be more severe due to the pressure change.


As the air in the storm rises, it cools. As the air cools, moisture within the air condenses to form clouds and rain and snow. Falling barometric pressure, or the approach of a low pressure area, is often an indicator of rain, ice and snow arriving soon. As the amount of rising air increases, air must rush in from the sides to replace the rising air near the center of the storm. The more violent the rising air near the center, the faster the air must rush in from the sides. This is what sometimes creates strong winds.

The rotation of the Earth creates a force that causes the rushing air coming in from the sides to spin counterclockwise in the Northern Hemisphere and clockwise in the Southern Hemisphere. In some rare causes, tornadoes may rotate clockwise in the Northern Hemisphere. This is because tornadoes are a very small-scale storm.

Often as a storm approaches, winds blow from the south or east. Often as a storm departs, winds blow from the west or north. This rotation is what helps to pump warm air in ahead of the storm and draw cold air in behind the storm. For example, in the winter, snow may turn to ice and rain as a storm approaches, then rain may end as snow or flurries as the storm departs.


In some of the most violent storms, such as hurricanes, typhoons and Indian Ocean cyclones, a doughnut-shaped area of high winds with rising air occurs near the storm center. However, right at the center of the storm, the air sinks enough to tame the winds and sometimes cloud-free conditions. This is called the eye of the storm.

Make sure to remember this when storms arrive this winter as there may be a pop quiz. 

BEST OF THE BLOG:


As a reminder, the North County Board Meeting is back at it again tomorrow, Friday, September 24th. As a refresher, the NCBM is a group of business professionals looking to make our community a better place. And you can too. There's no cost to join- you just need to be a surfer. So if you're reading this, you probably qualify. And no skill required either! Whether your a first-timer on a foamy or competed on the World Tour (you know who you are), come on down to Seaside Reef tomorrow (Friday) from 7 to 9 AM to:
  • network
  • grab some breakfast
  • check the surf
  • and find out how you can help support your community at our next charity event 
Just look for the tent on the beach. Please contact me at northcountyboardmeeting@gmail.com with any questions. 

PIC OF THE WEEK:


Not as long as the Surf Ranch, but the best things in life are free. 

Keep Surfing, 
Michael W. Glenn
Uncanny
Got All Kinds Of Friends Now That I Won The Lottery
Inventor Of The Huntington Hop, Waimea Wiggle, And Shark Island Shimmy

Thursday, September 16, 2021

THE Surf Report


Chill...

SURF:

Everyone good now? That was a BUSY week. Heaps of surf, more crowds than you can shake a stick at, and 2 world champs crowned at firing Lowers. Time to take a deep breath and hit the reset button. 


Our good swells the past week have subsided and we've got waist high S for the weekend with maybe a touch better wave towards the OC. All in all look for small surf this weekend and pleasant weather. And here's the tides, sun, and water temps for the next few days:
  • Sunrise and sunset:
    • 6:35 AM sunrise
    • 6:50 PM sunset
    • Almost to fall- 12 hours of sun and 12 hours of dark on Monday! 
  • As you've probably guessed by now, we've already passed prime season for our warm water temps (which happens to be late August/early September). Not much of a summer unfortunately as pesky WNW winds kept our water temps fluctuating. Look for mid-high 60's this weekend and from here on out... put the trunks away until next July
  • And pay attention to the tides again this weekend:
    • 3' at sunrise
    • about 5' at 9 AM
    • 1.5' after lunch
    • 6' at sunset
FORECAST:

Let's get the easy stuff out of the way: Nothing from the tropics. Again. 


As far as the Aleutians go, it's starting to come to life- which it should- as we're only a few days from the start of fall (Monday that is). A small storm is taking shape this weekend which will bring waist high NW on Monday to N County SD and chest high sets to SD. 


As far as the southern hemisphere goes, it took a breather last week but should awaken slightly this weekend. Look for more waist high SW next weekend the 24th in N County SD and chest high waves in the OC. 


Models then show a better storm taking shape in a few days and that could give us chest high surf again in N County SD and shoulder high surf in the OC around the 26th. Nothing big on the horizon but just enough to keep us sane. 

WEATHER:


Is it just me or is it starting look and feel like fall outside? Air temps seem a little cooler, the sky has a yellow tint to it, I'm wearing a wetsuit again, and the Aleutians are coming to life. And as they do, a weak cold front will impact the Pacific NW & northern Rockies this weekend and high pressure will set up behind it early next week. Look for a VERY weak Santa Ana pattern Monday/Tuesday with a little warmer temps and light offshores in the AM. If anything changes between now and then, make sure to follow North County Surf on Twitter!

BEST BET:

Tomorrow with leftover small SW, Monday with a touch of NW on the first day of fall, or wait until the 26th if you can for new playful SW. 

NEWS OF THE WEEK:


Looking to get out of the house and join the real world again? You've come to the right place! The regionally famous North County Board Meeting is back and bigger than ever. For those of you new to the game, the North County Board Meeting is a group of business professionals looking to make our community a better place. And you can too. There's no cost to join- you just need to be a surfer. So if you're reading this, you probably qualify. And no skill required either! Whether your a first-timer on a foamy or competed on the World Tour (you know who you are), come on down to Seaside Reef next Friday the 24th from 7 to 9 AM to:
  • network
  • grab some breakfast
  • check the surf
  • and find out how you can help support your community at our next charity event 
Thanks for everyone's patience during these unique times and we'll see you next Friday the 24th at Seaside. Just look for the tent as usual! Please contact me at northcountyboardmeeting@gmail.com with any questions. 

PIC OF THE WEEK:


I'm looking forward to bigger and better things this winter. Here's to 2022! (And for more pics to get you fired up for the upcoming 4/3 fullsuit season, check out Mark McInnis' work here).

Keep Surfing, 
Michael W. Glenn
Demigod
Selling Birthday Wishes On Cameo
Some Might Say I'm The American Medina

Thursday, September 9, 2021

THE Surf Report


The Emergency Boardriding System Is On Standby.

SURF:


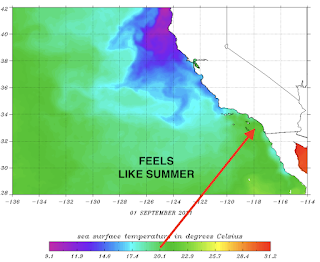
Had some small but fun surf this week. AND the weather cooperated. AND the water warmed up after a brief letdown from 70 degrees to 60 degrees and back to 70 degrees all within a week. 


I seriously think the water temps are harder to predict than the actual weather or waves. But besides all that, we've got some good surf headed our way, so let's get to it. 


We had a small storm off New Zealand last week and that is sending us waist surf on Saturday with chest high sets late in the day. That swell builds further on Sunday for shoulder high sets by sundown. Look for small but SW on Saturday and better surf later Sunday. And here's the tides, sun, and water temps for the next few days:
  • Sunrise and sunset:
    • 6:31 AM sunrise
    • 6:58 PM sunset
  • Water temps are still slightly below normal (70 vs. 75) but I'd still wear trunks and a jacket if the sun was out.
  • And pay attention to the tides this weekend:
    • 1.5' at sunrise
    • 5.5' at lunch
    • and 1' at dinner
FORECAST:

Looks like the Emergency Boardriding System will need to be activated next week. 


The building swell from Sunday will result in head high+ surf in N County SD and well overhead+ in the OC for Monday- along with a small NW that may help peak up the swell. The swell will most likely peak Monday and still be solid Tuesday morning. 


The swell reformed as it headed towards South America and sent a 2nd pulse to give us more shoulder high waves on Wednesday (and bigger in the OC due to the S angle). On a side note, for all you surf jocks out there, I'm assuming the World Surf League will run their playoffs at Lowers on Monday- unless the swell is too big (a good problem to have). Regardless, make sure to tune in Sunday just in case. As far as next weekend goes, there will be some background SW/NW for more waist to chest high surf. 


And further out, models show more modest SW from Antarctica (i.e. waist to chest high) arriving the first week of fall. It's about time! 


And for you fans of Hurricane Olaf, Cabo is getting slammed tonight with 20'+ surf and will die before it hits our window. Won't matter though with the solid SW next week. 

WEATHER:


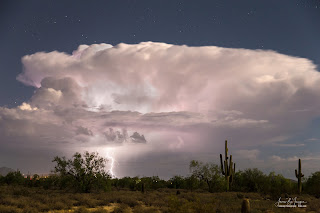
Warm weather is on tap for Southern California this weekend. We have a slight heat wave inland on Friday/Saturday and a small chance of thunderstorms in the mountains, but here along the coast- just typical night/morning low clouds/fog and temps in near 80. Things slowly cool down next week and we get more extensive night/morning low clouds/fog. If anything changes between now and then, make sure to check out North County Surf on Twitter!

BEST BET:
Sunday with increasing SW or Monday-Wednesday with firing SW! 

NEWS OF THE WEEK:


Summertime around here is an interesting cat. You would think living in a desert (yes, that means us So-Cal residents), we wouldn't see any rain during the hottest time of the year- our summer. But of course we do, as our mountains/deserts all summer long see flash flood warnings (like today) and we get the odd downpour here at the coast (which I can confirm during my lightening incident on 8/29). But what causes the monsoon moisture to surge into the Desert Southwest this time of year? Here's the National Oceanic and Atmospheric Administration to explain:

If you live in the U.S. Southwest or northwestern Mexico, you may already be familiar with the annual climate phenomenon called the North American Monsoon, especially since rainfall in some spots has been way above average this summer. In fact, this monsoon may turn out to be the wettest on record for some places. More on that later… Now, let’s take a sojourn through some North American Monsoon basics:

What is the North American Monsoon?
The North American Monsoon is a seasonal change in the atmospheric circulation that occurs as the summer sun heats the continental land mass. During much of the year, the prevailing wind over northwestern Mexico, Arizona, and New Mexico is westerly (blowing from the west) and dry. (Going forward, to avoid having to say “northwestern Mexico, Arizona, and New Mexico” over and over, I’ll refer to this area as “the monsoon region.”)

As the summer heat builds over North America, a region of high pressure forms over the U.S. Southwest, and the wind becomes more southerly, bringing moisture from the Pacific Ocean and the Gulf of California. This circulation brings thunderstorms and rainfall to the monsoon region, providing much of their annual total precipitation.

The monsoon starts to develop in Mexico in June, and moves into the U.S. Southwest in July. By early to mid-September, wind patterns have generally reverted back to the westerly pattern, bringing an end to the monsoon. There is some variability in the onset and demise of the monsoon.


What impacts does it have on Mexico and the U.S. Southwest?
Rainfall associated with the monsoon is very important for the region. Northwestern Mexico receives upwards of 75% of its average annual precipitation from it, and Arizona and New Mexico more than 50%, during July–September.

For many of us, the word “monsoon” conjures images of heavy rain lasting for months. While that’s often the situation for the Indian monsoon, the monsoon in North America behaves a bit differently. The rainfall generally has a strong diurnal cycle, meaning a daily pattern of mostly dry mornings, storms developing through the day, and most rainfall occurring in the afternoon and evening. Some of these thunderstorms can be strong, delivering heavy rain and frequent lightning. Monsoon rainfall activity tends to be grouped into bursts, with periods of rainy days interspersed with drier periods, rather than rain every day. Also, the occasional eastern Pacific tropical storm can increase monsoon moisture and rainfall.

The impacts of the monsoon go beyond just rainfall amounts. There is also an important relationship between rainfall and temperature: usually, more rain leads to cooler conditions, and less rain leads to hotter conditions. One recent study explored the relationship between the monsoon and wildfires in the Southwest and northern Mexico, finding that monsoon rains were important for ending wildfires.

When was the North American Monsoon discovered?
The rainy season would have been critical for Native Americans for thousands of years, and, for some Native American tribes, continues to be so. Scientists first noted the seasonal rainfall patterns in the Southwest in the early 20th century, with the circulation pattern being understood as monsoonal by midcentury. A couple of field campaigns, including the Arizona-based South-West Monsoon Project (SWAMP, 1993) and the international North American Monsoon Experiment (NAME, 2004), provided a lot of observational data and resulted in a better understanding of the mechanics of the monsoon.

What affects the North American Monsoon?
Although there has been a fair amount of research into the monsoon, there are still far more questions than answers about how it works, and if the seasonal amount of rain, potential start date, or other characteristics can be predicted. I listened to the Southwest Climate Podcast from CLIMAS, the Climate Assessment for the Southwest, to learn more about what affects the monsoon and its rainfall, and how Monsoon 2021 is shaping up, and reached out to the podcast co-hosts, Zack Guido and Mike Crimmins, for help with this post.

Rainfall, as anyone who has read the ENSO Blog before will know, is an extremely complicated thing to predict. When you add in the sparse rain-gauge observations available in the U.S. Southwest and Mexico, it becomes even more difficult to make confident statements about the effects of the monsoon and how it can be predicted. In the podcast episode “2021—a generational monsoon?” Zack listed some of the factors that influence how much moisture is available to the monsoon, including the position of the high-pressure area, wind patterns, and transient weather features. Another player is land-surface feedbacks—wetter soils provide more moisture to the air through evaporation.

Zack also mentioned our good friend El Niño. Here at the ENSO Blog, we’re always curious about the role of ENSO (El Niño/Southern Oscillation, the entire El Niño/La Niña system). He pointed out that ENSO does influence Pacific tropical storms, which can supply moisture to the monsoon.

I did a quick comparison of the average July–August rainfall in the monsoon region with the Niño-3.4 index, using 70 years of records. Some earlier studies suggested that El Niño may be related to lower July–August rainfall, and La Niña related to higher rainfall, due to large-scale atmospheric circulation changes. 


“Hey! But El Niño leads to ­more tropical storms than average,” you’re saying, because you’re not new here. “How would that result in less total July–August rain?” Good question! And yet another element of the monsoon system that needs more study to resolve.

How is climate change affecting the North American Monsoon?
Likewise, it’s not yet clear how the monsoon is changing in the warming climate, or how it will in the future. Zack and Mike mention that last year was an extremely dry monsoon, and this year is extremely wet. So is climate change increasing monsoon variability? It’s largely too soon to tell. When you take an already highly variable phenomenon like rainfall, add in uncertain regional climate change impacts, and factor in the sparse data record, it gets difficult to make a strong case about exactly how the monsoon rainfall is changing.

However, while the effect of warming on the storms is uncertain, temperatures have been increasing. The warming conditions alone can be impactful, drying out soils quicker during breaks in monsoon rainfall, for example.

The recent Intergovernmental Panel on Climate Change (IPCC) Sixth Assessment Report covers observed and potential future changes in the North American Monsoon. Regarding changes that have already occurred, the report finds modest evidence that the monsoon rainfall has intensified since the 1970s, and this has been partly attributed to greenhouse gas emissions. On the other hand, there is not much agreement among projections for future change in the monsoon, except for regarding the timing—most projections suggest that, under continued climate change, the monsoon will start later in the summer and end later in the fall than it currently does.


What about this year?
It depends where you are! Zack and Mike described this year’s monsoon for southern Arizona as “generational,” meaning once in a generation. It’s not over yet, but possible that the overall monsoon rainfall in Arizona will end up being the highest on record. Some regions have received more than 200% of the average rainfall, and Tucson recorded its wettest month ever this July. On the other hand, New Mexico and northern Mexico are near or a bit below average.

While this will help with the ongoing drought in the southwest, in many regions the precipitation deficit has been building for a long time. The current drought outlooks expect that the drought in Arizona and New Mexico will improve in the short term, but persist. 

PIC OF THE WEEK:


The guys on the beach probably thought it was crowded until this gem slipped by unridden. Inevitably they'll paddle out and add to the mayhem, thinking there's a chance...

Keep Surfing, 
Michael W. Glenn
Tenacious
Accredited Valentine Man
I Don't Ride Big Waves 'Cause I Have A 100' Minimum

Thursday, September 2, 2021


The Only Work Allowed On Labor Day Is Working On Your Airs. 

SURF:


Thanks goodness there was lightening this past week because the surf was downright boring. Look at the bright side- no one was out in the water anyway. Enough of the small talk- we all have a long holiday weekend in front of us- is there going to be any surf? Short answer: Yes. Kind of. Basically not big enough to launch the Emergency Boardriding System yet (more on that below). But it will be rideable and that's all I need for 3 days off. 


A medium sized storm formed off Antarctica last weekend and moved in an unfavorable E to W direction (not aimed N towards us) but it was big enough to send waist high surf with chest high sets in far N County SD and the odd shoulder high wave in the OC. Look for building waist high SW on Friday and more chest high sets late Saturday into Monday morning. Weather should also be nice and the water temps manageable. And here's the tides, sun, and water temps for the next few days:
  • Sunrise and sunset:
    • 6:26 AM sunrise
    • 7:09 PM sunset
  • Water temps are slightly below normal (70 vs. 75) but I'd still wear trunks and a jacket if the sun was out.
  • And tides aren't that dramatic this weekend:
    • 2' at sunrise
    • 4.5' mid-morning
    • 2' after lunch
    • and 5' at sunset
FORECAST:

The SW from Labor Day winds down to the waist high range with chest high sets in the OC by Tuesday. Further out, we've got a couple more storms on the horizon from the Southern Hemisphere. 


First up is a little blip for more chest high sets around next weekend. 


After that, there's a better SW swell arriving mid-month for shoulder high waves. Hoping to FINALLY turn on the Emergency Boardriding System by then. And if you're a fan of pro surfing- then the impending mid-month swell should be darn good for the finals at Lowers. I'm totally geeking out right now. 

WEATHER:


Almost got killed on the highest point in Encinitas on Sunday afternoon as I was 'storm chasing' thunderstorms. What I thought was 10-15 miles out was actually overhead and a few lightening bolts later, I made it home with the hair standing on the back of my head. That excitement has since left the region and we've got pleasant weather for the holiday weekend. Monsoon moisture may return by mid-week but it most likely will be confined to the mountains and deserts. If anything changes between now and then, make sure to follow North County Surf on Twitter!

BEST BET:
Sunday with fun waist to chest high SW or better shoulder high SW mid-month.

NEWS OF THE WEEK:


It seems like 2021 is coming at us fast and furious. Between Hurricane Ida streamrolling the eastern half of the US or wildfires marching towards Lake Tahoe, 2020 is a distant memory. But unfortunately, there may be some news you missed from last year. A new State of the Climate report confirmed that 2020 was among the three warmest years on record dating to the mid-1800s, even with a cooling La Niña influence in the second half of the year. New high temperature records were set across the globe. The report found that the major indicators of climate change continued to reflect trends consistent with a warming planet. Several markers such as sea level, ocean heat content, and permafrost once again broke records set just one year prior. Notably, carbon dioxide (CO2) levels in the atmosphere also reached record highs in 2020, even with an estimated 6%–7% reduction of CO2 emissions due to the economic slowdown from the global pandemic.

These key findings and others are available from the State of the Climate in 2020 report released last week by the American Meteorological Society (AMS):

The 31st annual issuance of the report, led by NOAA National Centers for Environmental Information, is based on contributions from more than 530 scientists from over 60 countries around the world and reflects tens of thousands of measurements from multiple independent datasets. It provides a detailed update on global climate indicators, notable weather events and other data collected by environmental monitoring stations and instruments located on land, water, ice and in space.

The report’s climate indicators show patterns, changes and trends of the global climate system. Examples of the indicators include various types of greenhouse gases; temperatures throughout the atmosphere, ocean, and land; cloud cover; sea level; ocean salinity; sea ice extent and snow cover. 


Report highlights include these indications of a warming planet: 
  • Greenhouse gases were the highest on record. As they do each year, and again in the midst of a global pandemic that slowed economic activity around the world, the major greenhouse gas concentrations, including CO2, methane (CH4) and nitrous oxide, rose to new record high values during 2020. The global annual average atmospheric CO2 concentration was 412.5 parts per million. This was 2.5 parts per million greater than 2019 amounts and was the highest in the modern 62-year measurement record and in ice core records dating back as far as 800,000 years. The year over year increase of methane (14.8 parts per billion) was the highest such increase since systematic measurements began
  • Global surface temperature was near-record high. Annual global surface temperatures were 0.97°–1.12°F (0.54°–0.62°C above the 1981–2010 average, depending upon the dataset used). This places 2020 among the three warmest years since records began in the mid- to late 1800s. This was the warmest year on record without the presence of El Niño. The seven warmest years on record have all occurred in the past seven years, since 2014. The global average surface temperature has increased at an average rate of 0.14°F (0.08°C) per decade since the start of the record; since 1981, the rate of increase has been more than twice as high.
  • Upper atmospheric temperatures were record or near-record setting. In the region of the atmosphere just above Earth’s surface, the globally averaged annual lower troposphere temperature equaled the record high of 2016. In the layer above that, the lower stratosphere temperature continued to decline, as expected in a warming world. 
  • Sea surface temperatures were near-record high. The globally averaged 2020 sea surface temperature was the third highest on record, surpassed only by 2016 and 2019, both of which were associated with El Niño conditions.
  • Global upper ocean heat content was record high. Globally, upper ocean heat content reached record highs in 2020 in the upper layer measured from the surface to 2,300 feet (700 meters), according to four of the five datasets analyzed in the report. This record heat reflects the continuing accumulation of thermal energy in the top 2,300 feet of the ocean. Ocean heat content was also record high in the deeper layer beneath, from 700 to 2,000 meter depth, according to all five datasets. Oceans absorb more than 90% of Earth’s excess heat from global warming. The warmer upper ocean waters can drive stronger hurricanes and increase melting rates of ice sheet glaciers around Greenland and Antarctica.

  • Global sea level was highest on record. For the ninth consecutive year, global average sea level rose to a new record high and was about 3.6 inches (91.3 millimeter) higher than the 1993 average, the year that marks the beginning of the satellite altimeter record. Global sea level is rising at an average rate of 1.2 inches (3.0 centimeter) per decade due to changes in climate. Melting of glaciers and ice sheets, along with warming oceans, account for the trend in rising global mean sea level.
  • Oceans absorbed a record amount of CO2.The ocean absorbed about 3.0 billion metric tons more CO2 than it released in 2020. This is the highest amount since the start of the record in 1982 and almost 30% higher than the average of the past two decades. More CO2 stored in the ocean means less remains in the atmosphere, but this also leads to increasing acidification of the waters, which can greatly harm or shift ecosystems.
  • The Arctic continued to warm; minimum sea ice extent was near-record low.The Arctic continues to warm at a faster pace than lower latitudes The annual mean surface air temperature for the Arctic land areas was the highest in the 121-year record, at 3.8°F (2.1°C) above the 1981–2010 average. This was the seventh straight year with an annual temperature more than 1°C higher than the 1981–2010 average. On June 20, a temperature of 38°C was observed at Verkhoyansk, Russia (67.6°N), provisionally the highest temperature ever measured within the Arctic Circle. The Arctic continues to warm at a faster pace than lower latitudes. With the warmth came fires. The Arctic experienced its highest fire year in terms of the amount of carbon released into the atmosphere, surpassing the record set in 2019 by 34%. The majority of the fires occurred in northeastern Siberia where abnormally high temperatures also occurred. In March, when sea ice reached its annual maximum extent, thin, first-year ice comprised ~70% of the ice; the thickest ice—usually more than four years old—had declined by more than 86% since 1985 to make up just 2% of total ice in 2020. When the minimum sea ice extent was reached in September, it was the second smallest in the 42-year satellite record, behind 2012. The Northern Sea Route along the Siberian coast was open for about 2.5 months, from late July through mid-October, compared to less than a month typically.
  • Antarctica saw extreme heat and a record-long ozone hole. Extreme warmth was observed across parts of Antarctica during austral summer, contributing to a major heat wave. On February 6, Esperanza Station reached 64.9°F (18.3°C), the highest temperature ever recorded on the continent, surpassing the previous record set in 2015 by 2.0°F (1.1°C). The warmth also led to the largest late-summer surface melt event in the 43-year record, affecting more than 50% of the Antarctic Peninsula and impacting elevations as high as 1,700 meters. Later in the year, the Antarctic polar vortex was unusually strong and persistent, with polar temperatures in the stratosphere at record low levels throughout November and December. This strong vortex was linked to the longest-lived ozone hole over the Antarctic region, which lasted to the end of December. Record-low ozone values in late austral spring and early summer led to unusually high levels of UV radiation across the Antarctic region.
  • Tropical cyclones were well-above average overall. There were 102 named tropical storms during the Northern and Southern Hemisphere storm seasons, well above the 1981–2010 average of 85. Three tropical cyclones reached Saffir–Simpson scale Category 5 intensity. The North Atlantic hurricane basin recorded a record 30 named storms, surpassing the previous record of 28 in 2005. Seven of those storms became major hurricanes, matching 2005 for a record number. Major Hurricanes Eta and Iota made landfall along the eastern coast of Nicaragua in nearly the same location within a two-week period, impacting over seven million people across Central America. In the western North Pacific, Super Typhoon Goni was the strongest tropical cyclone to make landfall in the historical record and led to the evacuation of almost one million people in the Philippines. Very Severe Cyclonic Storm Gati made landfall over Somalia, the first storm of such intensity to do so.

Additional geographical regional highlights include:

  • North America
    • Mexico reported its warmest year in its 49-year record, tied with 2017 and 2019.
    • The contiguous United States reported its fifth-warmest year. Alaska reported its coolest year since 2012, although it was still warmer than its 1981–2010 average. The annual temperature for Alaska has increased at an average rate of 0.50°C per decade over the past half century.
    • Most of Mexico was drier than average in 2020 due to the late onset of a weak North American Monsoon and a lack of tropical cyclones on the Pacific side. The United States was dominated by warm, dry air in the West and an active storm track that brought wet conditions to much of the East.In Canada, the Avalon Peninsula in Newfoundland was hit by a strong blizzard with hurricane force winds in January. The storm contributed to the snowiest January on record for Saint John’s.
  • Central America and the Caribbean
    • The annual average temperature over the Caribbean basin was the second highest since the start of the record in 1891. Annual average maximum temperatures were record high for stations in The Bahamas, Dominica, and Trinidad and Tobago. 
    • Powerful Category 4 Hurricanes Eta and Iota impacted Central America in November, making landfall along the eastern coast of Nicaragua in nearly the same location within a two-week period.
  • South America
    • Most of South America had above-average temperatures during the year. Central South America reported its second-warmest year for the region in its 61-year record, behind only 2015. During a strong heat wave in October, the city of São Paulo, Brazil, recorded four of its five all-time daily maximum temperatures.
    • The Bolivian lowlands suffered one of its most severe droughts on record during autumn. Drought also spanned the Chaco and Pantanal in Bolivia, Paraguay and southern Brazil. The Paraguay River shrank to its lowest levels in half a century. A decadal “mega drought” in south-central Chile continued through its 11th year, with extreme conditions in the most populated areas. Argentina reported its driest year since 1995.
  • Africa
    • Seychelles, an archipelago in the Indian Ocean off East Africa, observed its highest annual temperature in the record dating to 1972. In West Africa, Nuguru, Nigeria, observed about 80 days of maximum temperatures exceeding 104°F (40°C) in 2020, surpassing its previous record of 77 days in 2019. 
    • Extremely heavy rains in April triggered widespread flooding and landslides in Ethiopia, Somalia, Rwanda and Burundi. The Lake Victoria region was the wettest in its 40-year record, and the lake itself rose more than three feet (one meter) due to the excessive rain. 
  • Europe
    • The year 2020 was the warmest year on record for Europe, with all five of the warmest years occurring since 2014. Record warmth was reported for Belarus, Belgium, European Russia, Estonia, Finland, France, Kazakhstan, Lithuania, Luxembourg, the Netherlands, Norway, Poland, Spain, Sweden, Switzerland and Ukraine.
    • In February, almost all areas in Europe observed temperatures more than 5°F (3°C) higher than average. Biarritz in southern France reached a temperature of 80.0°F (26.6°C), which is higher than the monthly average for July and August. 
    • The Middle East experienced an extreme drought during autumn, with most places reporting 0%–20% of their typical precipitation in September and no precipitation at all in October.
  • Asia
    • In 2020, Japan and Russia each observed their highest annual temperature on record. In northern Siberia, annual temperatures were more than 9°F (5°C) above average across vast territories. The average winter temperature for all of Russia was 5°C above normal. In East Asia, Hong Kong, China, reported 50 hot nights, where the daily minimum temperature did not dip below 82.4°F  (28.0°C), and 47 very hot days, where the daily maximum temperature reached at least 91.4°F (33.0°C), both of which set new annual records. 
    • The 2020 Southwest Asian Monsoon season (June–September) was the wettest since 1981, coincident with the emergence of La Niña. The Meiyu season (July–August), a typical rainy season over the Yangtze and Huaihe River Valleys of China, doubled its typical duration by two months in 2020. The May–October total rainfall averaged over the area was the most since the start of the record in 1961. Associated severe flooding affected about 45.5 million people.
    • As is typical, several tropical cyclones impacted Asia in 2020. Super Typhoon Goni was the strongest storm on record anywhere in the world to make landfall. More than one million people were evacuated from its path in the Philippines. Eight tropical cyclones directly affected Vietnam. Typhoon Molave was one of the most intense storms to reach the country in the past 20 years.
  • Oceania
    • Most locations across Micronesia were drier than average during the first half of 2020 and wetter than average at all locations in the second half. For the year, Kosrae was record wet, while Kapingamarangi and Saipan observed near-record low annual rainfall totals. 
    • The last days of 2019 and first days of 2020 saw particularly hazardous fire weather in eastern Australia, where multiple fires had been burning since austral spring 2019. The emergence of La Niña was a welcome change for the Australian region, with this phase of ENSO contributing to increased rainfall over the continent, after a very significant 2019/20 fire season. Even with increased rainfall, this was Australia’s fourth-warmest year in its 111-year record. Both November and spring as a whole had record high temperatures.
    • Aotearoa, New Zealand, reported its seventh-warmest year since records began in 1909, in part due to its warmest winter on record. La Niña conditions contributed to higher temperatures in the latter part of the year. From late-December 2019 through February 2020, several areas across New Zealand observed record or near-record dry spells, that is, at least 15 consecutive days with less than one millimeter of rain each day. A 64-day dry spell, the longest on record, was reported in Blenheim, a town on the northern tip of the South Island.
PIC OF THE WEEK:


Another shot of California from the early 1900's with just George Freeth and a handful of friends enjoying some gentle rollers. 

Keep Surfing, 
Michael W. Glenn
All Pro
Child Star On Dynasty
Wasn't Allowed To Win The Bud Tour, Smirnoff, Or Foster's ASP Tour 'Cause I Was Under 21