Thursday, May 28, 2020

THE Surf Report- Early Edition


Don't make me activate the Emergency Boardriding System...

SURF:


Fun week of surf if I don't say so myself. Not the biggest, but plenty of shoulder high surf to go around. The sun even peeked out once the May Gray burned off. For the upcoming weekend (and beyond), we've got more fun surf coming. So I'm activating the Emergency Broadcast System. 


Starting tomorrow, the SW swell train we've been enjoying lately keeps moving down the tracks and we'll get another shot of shoulder high swell by late in the day. 


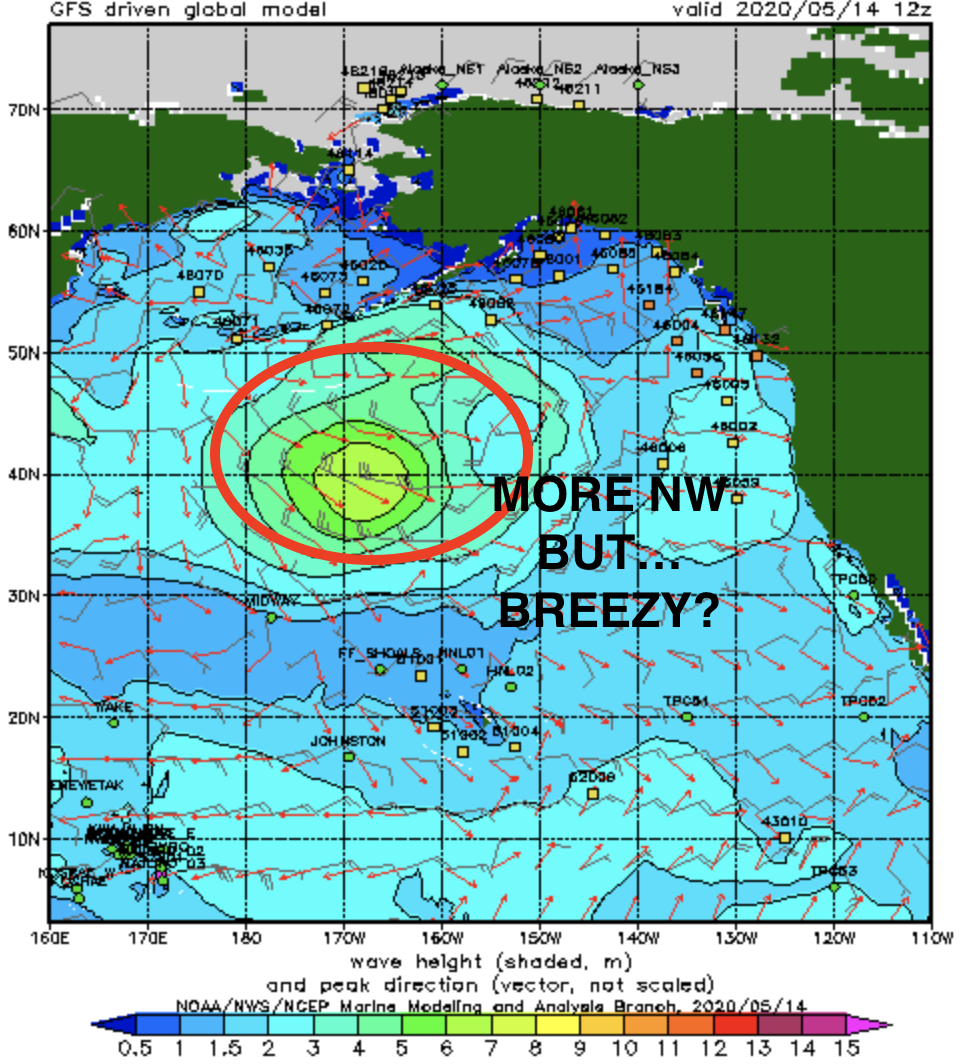
On Saturday, the SW continues and it's joined by a late season chest high NW. Both swells will give us head high surf through Sunday. The only fly in the ointment is, that weak low pressure system which is giving us that new NW, will also keep the clouds lingering at the beaches all weekend. Small price to pay for good surf. As far as the sun/water temps/tides go, here's what you need to know:
  • Sunrise and sunset are:
    • 5:42 AM sunrise (5:30 AM paddle out)
    • 7:51 PM sunset (paddle in 8:00 PM)
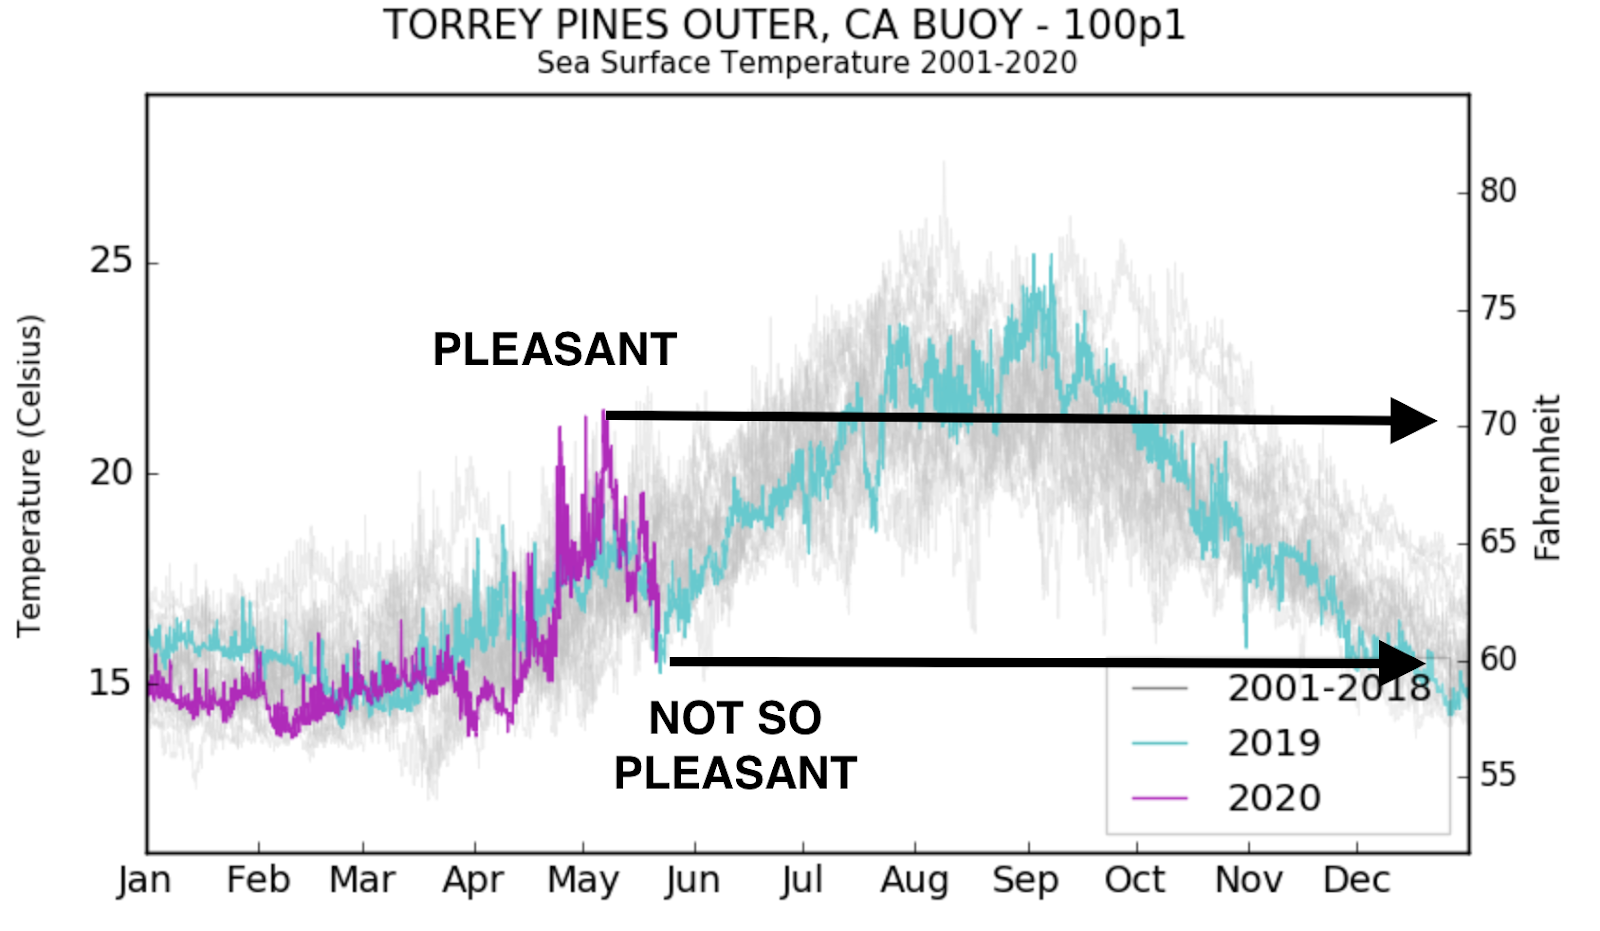
  • Water temps are finally coming around after all the WNW wind last week and are sitting at 67. 
  • And tides this weekend are:
    • 3' at sunrise
    • 0' before lunch
    • 4' late afternoon
    • 3' at sunset
FORECAST:
The fun combo swells this weekend continue into Monday. The NW backs off Tuesday but we still have fun chest high+ SW. 


By Wednesday afternoon, we have yet another good SW showing up. 


Thursday has another waist high NW arriving and we're back to head high+ surf from the combo swells. That lasts into Friday. 


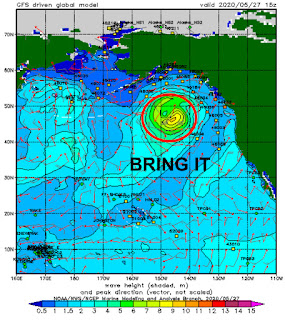
And after THAT... models show yet another SW forming this weekend which will send shoulder high surf around the 7th (late next Sunday). So again, I'm activating the Emergency Boardriding System. Use it or lose it is what I say. 

BEST BET:
This weekend. Middle of next week. Late next weekend. Did I miss anything?

WEATHER:


Nice weather today will turn to May Gray this weekend. Temps will drop to a chilly 70 degrees along the coast due to the clouds hugging the shoreline most of the day. For next week, forecast charts are all over the place with one saying high pressure builds again for great weather while others say May Gray hangs around the beaches. My guess: We'll have low clouds/fog in the nights/mornings and partial sun in the afternoons. Make sure to check out Twitter/North County Surf if anything changes between now and then.

NEWS OF THE WEEK:


As we approach hurricane season, I thought we'd re-visit a topic I've discussed over the years about increasing water temps due to global warming and their potential impacts on the strength of hurricanes. Scientists over the years have been looking into how greenhouse gases, along with another pollutant, tiny particles called aerosols, could affect the strength of tropical cyclones. (The strength, or intensity, of a tropical cyclone is measured by the near-surface wind speed.) What they've come across is a puzzling question: Despite increasing ocean temperatures, why haven’t we seen a similar clear global increase in the strength of tropical cyclones? Here's the National Oceanic and Atmospheric Administration to explain:


Warmer water, stronger storms?
One reason we may expect stronger tropical cyclones is because they draw their strength from warm ocean waters. Warm, moist air above the ocean surface rises and forms thunderstorms. Scientists have long expected that the warmer oceans resulting from global climate change would lead to stronger storms—warmer water, more rising moist air. While the oceans have clearly warmed substantially over the past several decades, very likely due to the heat-trapping effect of greenhouse gases, the global trend in the strength of tropical cyclones doesn’t quite match the sea surface trend. The past few decades or so do appear to show a slight increase in intensity globally, though, and some regions, like the North Atlantic, have shown a steeper pattern of stronger storms.

But we still can't say for sure that these changes are global-warming related. There are a lot of challenges when it comes to looking for long-term changes in these storms, including the relatively short (about 40 years) satellite observation record—which has its own uncertainties—and the substantial natural year-to-year variations in storm-conducive conditions. For example, El Nino has an impact on hurricanes. Also, of course, these storms are very complex, so there is more at work than just the temperature of the ocean surface. Given the extreme impacts caused by tropical cyclones, though, understanding the possibility of more intense storms in the future as our climate changes is critical.

Introducing… aerosols!
Scientists Adam Sobel and his colleague Suzana Camargo wanted to add to our understanding of the impact on tropical cyclones from another side effect of burning fossil fuels—aerosols, particles tiny enough to float in the air for days or weeks. Aerosols have a long list of different impacts on humans and the environment, including severe health effects. Aerosols can cool the climate by reflecting sunlight back into space, acting in opposition to greenhouse gas warming. Many scientists, dating back to at least 2006, have studied the effect of aerosols on tropical cyclones before, including how aerosols might counteract greenhouse gases.


Potential intensity
Earlier we discussed the recorded strength of tropical cyclones, but now we're going to switch to a slightly different measure—potential intensity, the upper limit to how strong a storm could possibly get. It’s a calculated quantity based on the temperature of the ocean surface and the temperature and humidity of the atmosphere above the ocean. To form the strong thunderstorms within a cyclone, the atmosphere needs to cool with height.

Adam, Suzana, and their team looked at how potential intensity has changed over the past several decades. Studying potential intensity allows us to understand the environment in which the storms are forming.  Higher potential intensity can lead to stronger storms, and if potential intensity increases under global warming, we will likely see more intense storms. You can think of potential intensity as an upper limit on growth, but most tropical cyclones don’t reach their full potential intensity, because there are a lot of factors that affect cyclone growth.

Greenhouse gas warming has dominated over aerosol cooling in influencing global ocean temperatures, but what is the dominant factor in driving potential intensity?  If aerosol cooling is more active in restraining potential intensity, it could be important for understanding why potential intensity has not yet increased as much as sea surface temperature has. If we can solve that puzzle, then we could get a better idea of what might happen to cyclones if aerosol pollution increases or decreases in the future.


Let’s do some science
Adam’s team used data from computer models that simulate sea surface temperature and tropical cyclone potential intensity from 1850, about when the industrial era began, to near-present. Their study examined global patterns, while many earlier studies focused on the Atlantic. Four different scenarios were considered: 1) What if we never started burning fossil fuels? (i.e., no greenhouse gases, no aerosols) 2) What if we emitted greenhouse gases but not aerosols? 3) What if we emitted aerosols but not greenhouse gases? and 4) What does it look like with both greenhouse gases and aerosols?

Let’s start with the simplest: If we hadn’t started burning fossil fuels, both sea surface temperature and potential intensity would have remained about the same from 1850 to now. But if we look at what happens with both greenhouse gases and aerosols—that is, reality, scenario 4)—sea surface temperature has clearly increased, but potential intensity hasn’t. It’s wobbled around quite a bit, but we don’t see the same clear upward trend as sea surface temperature until the last couple of decades.

It’s when we look at scenarios 2) and 3) that things get pretty interesting. The computer model shows that the warming effect from greenhouse gases on sea surface temperature is two to three times bigger than the cooling effect of aerosols. However, the increase to potential intensity caused by greenhouse gases is just about equal to the decrease caused by aerosols. Aerosols have complex interactions with the atmosphere, more than just reflecting sunlight back into space, including warming the atmosphere and affecting humidity. This means they have a stronger impact on restraining cyclone intensity than they do on counteracting ocean warming, partly explaining why the trend in cyclone strength doesn’t closely match the trend in sea surface temperature.

Aerosols aren’t really great
Despite somewhat countering both global warming and cyclone strength, aerosol pollution isn’t a good thing, likely causing millions of deaths per year. Policy and technological changes have led to reductions in aerosols in the US and Europe, even as greenhouse gas emissions continue to rapidly increase. So it’s likely that the restraining effect of aerosols on cyclone potential intensity will decrease in the future, and we may see more intense tropical cyclones.

There are many open questions about tropical cyclones—for example, we have no idea why approximately 90 storms form across the globe each year. Why not seven? Why not 400? These storms are as mysterious as they are powerful. Fortunately, there is a lot of ongoing research, so our understanding is growing every day.

PIC OF THE WEEK:


If Lowers was in the tropics (and not near a major metropolitan area), here's what it would look like. 

Keep Surfing,

Michael W. Glenn
Non-Fazed
Cup Is Neither 1/2 Full Nor 1/2 Empty- It's Always Full
Surf Scientician

Thursday, May 21, 2020

THE Surf Report- Early Edition


Things are looking up. 

SURF:
As we go flying through springtime, it's good to see the sun, beaches open, clean water, and surf finally. 


This past week had a mixed bag with solid surf if you could find a window between the wind. All in all there was waves, the red tide dissipated, and it's good to be on track again. For Friday, we've got another weak cold front moving by to the N and we'll just get breezy conditions down here for Friday. Look for more chest high bumpy sets from the NW with a touch of SW underneath. Saturday the NW windswell peaks with shoulder high sets and cleaner conditions while Sunday drops to the chest high range from the combo swells. As far as the sun/water temps/tides go, here's what you need to know:
  • Sunrise and sunset are:
    • 5:45 AM sunrise 
    • 7:45 PM sunset 
  • Water temps in N County have dropped if you didn't notice due to all the WNW wind this week. We literally went from 70 last weekend to 60 this weekend. We should though rebound to the mid-60's mid-week once high pressure sets up again. 
  • And tides are all over the place the next few days:
    • almost -1' at sunrise
    • 3.5' before lunch
    • 2' mid-afternoon
    • up to 5' at sunset
FORECAST:


For Memorial Day, we have new SW swell showing up to keep us in the chest high range. The storms in the southern hemisphere this past weren't that organized but they did have a lot of wind. Look for the SW to slowly build during the week for shoulder high surf by Wednesday and smaller NW windswell during the 1st half of the week. 


We get a little break late next week but still rideable from the SW then more shoulder high sets next weekend. 


After that, it looks to be more disorganized surf headed our way from the southern hemisphere and shoulder high surf again around June 4th. In a nutshell- nothing big the next 2 weeks but plenty of fun surf. 

BEST BET:
Saturday with clean NW windswell. Or Monday-Wednesday with new chest high SW. Or next weekend with more SW. Or June 4th with more SW...

WEATHER:


Even though we've had some windy days lately, I'll take that over May Gray any day. Jinx! (more on that later). For Friday, we've got a weak cold front moving by to the N which won't give us any clouds but it will give us more WNW wind. Look for it to be messy tomorrow with gusts close to 20 mph. Saturday and Sunday look nice with just a return of low clouds/fog in the nights/mornings. For next week, high pressure is in charge. While the deserts hit over 100, the coast will be a mild 70 with the fog lingering near the beaches all day unfortunately. Welcome back May Gray. Make sure to check out Twitter/North County Surf if anything changes between now and then.
 
NEWS OF THE WEEK:


The National Oceanic and Atmospheric Administration has released their annual Eastern Pacific Hurricane outlook and…

NOAA’s 2020 eastern Pacific Hurricane Season Outlook indicates a near- or below-normal season most likely (75% combined chance). There is a 40% chance of a near-normal season and a 35% chance of a below-normal season, followed by a 25% chance of an above-normal season. The eastern Pacific hurricane region covers the eastern North Pacific Ocean east of 140°W north of the equator.

The 2020 outlook calls for a 70% probability for each of the following ranges of activity:

• 11-18 Named Storms
• 5-10 Hurricanes
• 1-5 Major Hurricanes
• Accumulated Cyclone Energy (ACE) range of 60%-135% of the median.

The activity is expected to fall within these ranges in 70% of seasons with similar climate conditions and uncertainties to those expected this year. These ranges do not represent the total possible activity seen in past similar years. The predicted ranges are centered slightly below the 1981-2010 averages of 15 named storms, 8 hurricanes, and 4 major hurricanes. The eastern Pacific hurricane season officially runs from May 15th through November 30th. The peak months of the season are July-September (JAS).

Reasoning behind the outlook

Two climate factors are expected to contribute to a near- or below-normal 2020 hurricane season across the eastern (and central) Pacific hurricane basins, as follows:

1) The current and predicted SST anomaly patterns indicate below- or near-average SSTs across the eastern Pacific hurricane region, and above-average SSTs across the Atlantic Main Development Region (MDR). Historically, this combination tends to be associated with near- or below-normal hurricane activity.

2) The most recent forecast from the NOAA Climate Prediction Center indicates a likely continuation of ENSO-neutral conditions (i.e., no El Niño or La Niña), or even the development of La Niña. The ENSO influence on eastern Pacific hurricane activity is highly dependent upon the background SST patterns across the eastern Pacific hurricane region and the Atlantic MDR. For the SST anomaly patterns above, both ENSO-neutral and La Niña tend to favor reduced eastern Pacific hurricane activity, often resulting in a near- or below-normal hurricane season.

a. ENSO-neutral or La Niña most likely

ENSO-neutral conditions are present. The latest weekly SSTs are near average across the central and eastern equatorial Pacific, and the SST index for the Niño 3.4 region is -0.3°C. The Niño 3.4 region spans the east-central equatorial Pacific between 120°W-170°W and 5°N-5°S.

The Niño 3.4 index has recently cooled considerably. Previously this index was above +0.5°C during October 2019 through late April 2020. However, important El Niño impacts had been largely absent, which is why the CPC did not declare an El Niño. [NOAA classifies a weak El Niño as having a sustained Niño 3.4 index between +0.5°C and +1.0°C, along with consistent atmospheric impacts.] For example, during March-April 2020 convection was suppressed across the east-central and eastern equatorial Pacific Ocean, and the upper tropospheric circulation at 200-hPa featured enhanced mid-Pacific troughs in the subtropics of both hemispheres. Also, the easterly trade winds were stronger-than-average across the equatorial Pacific. None of these conditions reflect an El Niño, which by comparison would feature enhanced equatorial convection east of the date line, along with weaker mid-Pacific troughs at 200-hPa and westerly wind anomalies at 850-hPa.

Looking forward, model predicted SST anomalies in the Niño 3.4 region generally indicate ENSO-neutral (Niño 3.4 index between ± 0.5°C) throughout the hurricane season. The dynamical model average (red line) is on the cool side of zero, while the statistical model average (green line) is on the warm side of zero.

However, some of the dynamical models are indicating a transition to La Niña (Niño 3.4 index ≤ -0.5°C) as the summer progresses, which appears to be consistent with the enhanced trade winds and the recent decrease in SST anomalies across the equatorial Pacific Ocean. NOAA’s Climate Forecast system (CFS) is predicting La Niña during ASO 2020.

Based on current conditions, the recent oceanic evolution, model forecasts, and the low skill inherent in ENSO predictions made at this time of the year, NOAA’s latest ENSO outlook indicates about a 55% chance of ENSO-neutral during JAS and August-October (ASO), followed by a 35% chance of La Niña and only a 10% chance of El Niño.

An important measure of the total seasonal activity is NOAA’s Accumulated Cyclone Energy (ACE) index, which accounts for the combined intensity and duration of named storms and hurricanes during the season. This 2020 outlook indicates a 70% chance that the ACE range will be 60%-135% of the median. An ACE value of 80%-115% of the median indicates a near-normal season. Values above this range reflect an above-normal season, and values below this range reflect a below-normal season.


Eastern North Pacific high- and low-activity eras

In addition to year-to-year fluctuations, eastern Pacific hurricane activity exhibits strong variability on decadal and multi-decadal time scales. Periods of increased activity (such as 1982-94 and 2014-19) are called high-activity eras, and periods of decreased activity (such as 1971-1981 and 1995-2013) are called low-activity eras. The differences in seasonal activity between these two eras are considerable. High-activity eras average about 4.6 more named storms, 3.1 more hurricanes, 2.4 more major hurricanes, and 59 more ACE points, than low-activity eras. As a result, above-normal seasons occur about three times more frequently during high-activity eras (63% of seasons compared to 20%), and below-normal seasons are about four times less frequent (11% compared to 43%).

High- and low-activity eras are strongly related to global patterns of SST anomalies. It is upon these patterns that the inter-annual ENSO signal overlays. One such pattern is called the Pacific Decadal Oscillation (PDO). The PDO spans most of the North Pacific Ocean, and is associated with decadal fluctuations in hurricane activity. The positive (negative) phase of the PDO tends to be associated with high- (low-) activity eras. Another global SST pattern is the AMO. The cold (warm) phase of the AMO increases the likelihood of a high- (low-) activity era. The AMO helps to explain the inverse relationship in activity between the eastern Pacific and Atlantic basin, with a warm AMO favoring increased Atlantic activity and decreased eastern Pacific activity.

Looking at combinations of the AMO and PDO, the 1982-94 high-activity era was associated with a cold AMO and a positive PDO, while the 2014-19 high-activity era primarily featured a strong positive PDO. Conversely, the intervening 1995-2013 low-activity era featured a warm AMO and negative PDO.

Regarding 2020, the current and predicted SST anomalies reflect the ongoing warm phase of the AMO, which has been present since 1995. They also reflect near- or below-average SSTs across the eastern Pacific hurricane region, which projects onto the negative phase of the PDO. This PDO signal is in marked contrast to the exceptionally warm SSTs and positive PDO seen in the eastern Pacific during the recent 2014-19 high-activity era.

Confidence is not high that the negative PDO pattern will persist through the hurricane season. One reason is that SST forecasts made several months ahead tend to have limited skill. Another reason is that the current negative PDO signal partly reflects the synoptic-scale wind and pressure patterns associated with a highly-amplified High pressure system over the middle latitudes of the North Pacific. Therefore, the current conditions are not necessarily a longer-term transition to the negative PDO. These observations lead to larger uncertainty about the nature of the background climate signal upon which the ENSO signal will overlay during the peak months of the 2020 eastern Pacific hurricane season.

A closer look at ENSO during high- and low-activity eras

High- and low-activity era averages vary with ENSO phase, as seen for JAS Nino 3.4 SST anomalies ≤ -0.75°C, within ± 0.75°C, and ≥ 0.75°C. Although these ranges differ slightly from the official NOAA ENSO classifications, they are used to better isolate stronger El Niño and La Niña episodes from the weakest ones.

During high-activity eras, the highest levels of seasonal activity are seen for ENSO-neutral and El Niño years. These averages include 18-19 named storms, roughly 10-11 hurricanes, 6 major hurricanes, and an ACE between 135%-155% of the median. Consistent with these numbers, above-normal (near-normal) seasons are recorded in two-thirds (about 30%) of cases for both El Niño and ENSO-neutral. In contrast, for the single La Niña year in the high-activity era record, the seasonal activity included 13 named storms, 6 hurricanes, 1 major hurricane, and an ACE of 78% of median, all of which are well below the El Niño and ENSO-neutral averages.

During low-activity eras, the most major hurricanes (5) and highest ACE values (119% of median) on average are seen during El Niño years, and the fewest (roughly 3 major hurricanes and ACE of 80%-90% of the median) are seen for both La Niña and ENSO-neutral. The fewest named storms (12.4) and hurricanes (7.0) are seen during La Niña, with only slightly higher averages (14 named storms and 7.7 hurricanes) during both ENSO-neutral and El Niño.

For all parameters, the largest decreases during low-activity eras are seen for ENSO-neutral years, with average decreases of 4.5 named storms, 3 hurricanes, 3 major hurricanes, and 71 ACE points. El Niño years feature similar large decreases in both named storms and hurricanes, but only slight decreases in major hurricanes (0.7) and ACE (16 points).

During El Niño, the probabilities of above-normal (33%) and near-normal (67%) seasons during low-activity eras are essentially reversed compared to high-activity eras. For ENSO-neutral, the probability of an above-normal season drops sharply to near 15% during low-activity eras, and the probability of a below-normal season increases to near 50%. As a result, La Niña and ENSO-neutral have roughly similar probabilities for all three season classifications during low-activity eras.

Looking specifically at the seasonal activity that is historically associated with the predicted Niño 3.4 conditions for this season, the results are again highly dependent on whether the eastern Pacific is in a high-activity era or a low-activity era. If the negative PDO signal persists, the average activity would be about 14 named storms, 8 hurricanes, 3 major hurricanes, and an ACE of 82% of median. In contrast, if the positive PDO signal returns, the averages would increase to almost 20 named storms, 11-12 hurricanes, 6 major hurricanes, and an ACE of 160% of median. These analogues highlight the uncertainty in this hurricane outlook, which arises primarily because of uncertainty in predictions of the PDO and ENSO. The predicted ranges of activity for 2020 are designed to capture not only the predicted conditions, but also their uncertainty.

In summary; look for a slower than average hurricane season UNLESS water temps warm up slightly between Mexico and Hawaii resulting in an era of ‘high activity’. We can only hope. 

PIC OF THE WEEK:


Just like Indo. All you have to do is replace the pines for palms. 

Keep Surfing,

Michael W. Glenn
Handsome In 48 Languages
Was Known As Error Jordan On My Junior High Basketball Team
Giving The QS One Last Shot At Age 50

Thursday, May 14, 2020

THE Surf Report- Early Edition


Reunited and it feels so good. 

SURF:


With apologies to Peaches & Herb; darn it's good to see waves again. Regardless of beach access, red tide, and swirling winds, it felt so right to paddle out this week. As luck would have it, we've got more waves coming. Y'all must have been good lately. For Friday, we've got leftover SW ground/NW wind swells for waist to chest high surf and sunny skies. 


On Saturday we have new SW filling in that will be similar in size to the swell we just had a couple days ago (head high). We should also have more NW windswell to make the beach breaks peaky. Same goes for Sunday. As far as the sun/water temps/tides go, here's what you need to know:
  • Sunrise and sunset are:
    • 5:49 AM sunrise 
    • 7:42 PM sunset 
  • Water temps in N County are at best mid-60's due to the W wind we've had recently  
  • And tides are pretty simple this weekend:
    • 3.5' at breakfast
    • 0.5' at lunch
    • 4.5' at dinner
FORECAST:


After a fun weekend of swells, we get more SW/NW on Tuesday BUT... a late season cold front will put a damper on things. Look for it to be fairly junky with a chance of light showers. At least we're not getting mid-May snow in the Sierras. 


The cold front exits on Wednesday for a transitional day (i.e. could be windy/could be clean) and we'll have more SW swell for shoulder high surf again and clean conditions. 


Next weekend looks small, then we may get more fun shoulder high+ SW around the 25th AND another SW swell at the end of the month. Looks like our early spring surf drought is over?...

BEST BET:

Saturday to Monday before that cold front moves through. Or Wednesday/Thursday AFTER that cold front moves through.

WEATHER:


Nice weather this week will keep on rolling into Friday/Saturday with slightly above temps and plenty of sun. As mentioned above, we have a late season cold front headed our way and it will increase the low clouds/fog for Sunday, definitely cloudy by Monday, and breezy with a chance of light showers on Tuesday. Wednesday we see the sun again and the 2nd half of next week looks to be early summer weather. Sure beats May Gray, am I right? Make sure to check out Twitter/North County Surf if anything changes between now and then.
NEWS OF THE WEEK:


Even though the East Coast of America gets all of the fanfare during the Atlantic hurricane season (rightfully so), here on the Pacific side, there are a few things that could impact us after a storm forms off Mexico. Here's the Weather Channel to explain:

Hurricane season in the Eastern Pacific Basin officially starts Friday, May 15, and the start date is just over two weeks earlier than the official beginning of the Atlantic season. This is due to warmer waters, and the fact that wind shear is typically weaker earlier in the season compared to the Atlantic. The first tropical cyclone of the season has already formed in the Eastern Pacific Ocean. Tropical Depression One-E formed well south of Mexico's Baja California Peninsula on April 25 and became the earliest tropical cyclone on record in the Eastern Pacific Ocean. It did not impact any land areas.

The west coast of Mexico is impacted by Eastern Pacific tropical cyclones each year, and from time to time, very strong hurricanes have struck. In 2015, Hurricane Patricia – with winds up to 215 mph – became the strongest Eastern Pacific hurricane on record before making landfall in Mexico as a Category 4 storm. Additionally, hurricanes and tropical storms that form in the Eastern Pacific can occasionally be a concern for the southwestern U.S. and Hawaii, and there were reminders of this threat in the last several years.


From the Eastern Pacific to Hawaii

Two tropical cyclones tracked near Hawaii in 2019: hurricanes Erick and Flossie. Both systems brought high surf to Hawaii, and Erick enhanced rainfall on the Big Island, where several small landslides occurred. Hurricane Lane's Hawaii approach was the 2018 Eastern Pacific tropics' biggest story for the U.S. Lane developed over the Eastern Pacific in August 2018 and crossed into the Central Pacific Ocean. For reference, the dividing line between the Central and Eastern Pacific Ocean basins is 140 degrees west longitude. After intensifying to a Category 5 hurricane southeast of Hawaii, Lane weakened significantly as it passed more than 100 miles south of the island chain. Parts of the islands were swamped by flooding rainfall. Also in 2018, Olivia was the first tropical storm to make landfall over Lanai and Maui. Olivia prompted flooding on Maui and downed trees on Maui and Oahu a few weeks after Lane. Olivia formed in the Eastern Pacific and tracked into the Central Pacific. It weakened before making an unusual approach to Hawaii from the north. In 2014, Hurricane Iselle formed in the Eastern Pacific and moved into the Central Pacific, making landfall on the Big Island of Hawaii as a tropical storm on Aug. 8. There were reports of structural damage, trees downed, power outages and some flooding on the Big Island. Hurricane Iniki in 1992 might be the most serious example of the impacts Eastern Pacific tropical systems can generate in Hawaii. Iniki is the costliest hurricane in Hawaii's history; It originated in the Eastern Pacific on Sept. 5 and moved into the Central Pacific, where it became a powerful hurricane. The island of Kauai was hit especially hard by damaging winds when Iniki made landfall there as a Category 4 storm. Many structures were wiped out by storm surge flooding and large, battering waves along the southern coast. Hawaii is usually protected from tropical storms and hurricanes approaching directly from the east due to cooler waters and strong winds aloft, which contribute to weakening. Many other tropical storms and hurricanes have passed safely to the south of Hawaii because of high pressure north of the islands. It's the rare cases illustrated by Iniki and Lane – when a hurricane first moves south of the island, then arcs northward – that pose a greater threat to the state.


Southwest Tropical Flood Threat

Most Eastern Pacific tropical storms and hurricanes move away from land and are only a concern to shipping interests. But weather patterns at the beginning and end of the season are more conducive to tropical systems that affect Mexico and the southwestern U.S. Arizona is the Southwest state with the history of the most tropical storm encounters. According to the National Weather Service in Tucson, eight tropical storms or depressions have remained intact and impacted Arizona directly since 1965. Five of these were tropical storms with sustained winds of 39 mph or higher. Flooding rainfall is typically the biggest concern from any tropical systems that survive the journey into the southwestern U.S. Systems that are no longer tropical cyclones when they reach the U.S. can still produce flooding rains. While such a storm might no longer be intact, the remnant tropical moisture can fuel drenching rains as it moves into the region. Moisture from both Tropical Storm Ivo and Hurricane Lorena reached the Southwest in 2019. Moisture from Ivo's remnants triggered flash flooding in Las Vegas in late August. Showers and thunderstorms developed in parts of Arizona and New Mexico in response to Lorena's moisture in September. Flash flooding was reported, including near Phoenix. Remnant moisture from four former hurricanes reached areas from the Desert Southwest to Texas in 2018: Bud in June, along with Sergio, Rosa and Willa in October. The interaction between moisture from the remnants of Hurricane Dolores in July 2015 and a disturbance moving into California resulted in historic July rains in Southern California. Both Los Angeles and San Diego broke all-time July rainfall records at a time of year when rainfall is almost always scant in Southern California. San Diego in fact received over an inch of rain from Dolores which is even big for a storm in January! Also in 2015, moisture partially associated with Hurricane Linda led to flooding that killed 20 people in Utah on Sept. 4, according to the National Hurricane Center.


Southern California is the only portion of the Pacific coastline in the Lower 48 that could see a tropical storm or hurricane landfall from the Eastern Pacific. Although such an event is extremely rare, history shows it can happen. On Oct. 2, 1858, the only known hurricane to hit Southern California slammed into San Diego. Sustained hurricane-force winds resulted in extensive property damage. Only one tropical storm has made landfall in Southern California since then. In September 1939, a tropical storm with winds of 50 mph hit Long Beach. Flooding caused moderate crop and structural damage, according to the NWS in Oxnard. High winds surprised the shipping industry in the area, killing 45 people. While technically not a tropical storm at the time, what had been Hurricane Kathleen raced northward into the desert of southeastern California in September 1976. Wind gusts to 76 mph were measured in Yuma, Arizona, and a 4- to 6-foot wall of water destroyed 70 percent of homes in Ocotillo, California.

Cool ocean temperatures in the path of the tropical systems trying to reach the Pacific coast are the primary reason landfalls are so rare in Southern California. Coastal waters get dramatically cooler as you move north along the coast from Mexico. As in 1858, any hurricane would have to be moving fast enough, over waters just warm enough, to maintain its intensity on the way northward in order to have a California landfall. So if history is any indication, just expect good surf from hurricanes in Southern California and not much else. 

PIC OF THE WEEK:


"Heavy scab brah. Scar for life for sure. Scrub it kook!" (Still don't understand how this didn't win any Oscars). For more tropical locales I hope to be seeing in the near future, check out Chris Whitey's work on Instagram @chris.whitey.

Keep Surfing,

Michael W. Glenn
More Than Capable
High Score, Dig Dug, 35 Years Running. 
I Unfortunately Play Guitar Like Peter Townend And Surf Like Pete Townshend

Thursday, May 7, 2020

THE Surf Report- Early Edition


I'm activating the Emergency Boardriding System.

SURF:


As we head towards Karmantine (no red tide, beaches open, manageable winds, and good surf), let's reflect on the week that was: fun chest high combo swell, great weather, BUT... crazy red tides, and beaches open but parking lots/access not fully open. Where does that leave us for Friday and the weekend? Not much swell Friday but plenty good Saturday afternoon and beyond- so I'm activating the Emergency Boardriding System! 


First, a swell was generated off Antarctica last week that is marching up the Pacific as we speak. We'll see head high sets arriving by Saturday afternoon into Sunday and bigger at the best S swell spots in far N county SD. 


We also have small waist high WNW arriving this weekend too which may help break up the S lines. Hallelujah. On that note, I'm not one to preach, but do me a favor, and don't clog the line ups. Meaning: If you run down to surf and your spot is crowded, find an open spot down the beach (or come back later). Don't need our beaches closed again and a good swell gone to waste. This has been a public service announcement. As far as the weather goes this weekend, weather should be nice on Saturday (once the low clouds/fog burn off) with maybe only partial clearing on Sunday. At least it won't be windy. Let's just hope the red tide is gone by then too. As far as the sun/water temps/tides go, here's what you need to know:
  • Sunrise and sunset are:
    • 5:54 AM sunrise 
    • 7:37 PM sunset 
    • That's almost 14 hours of surfing. More than enough time for everyone to find an open window and keep the crowds down...
  • Water temps in N County are high 60's thanks to the 2 heat waves we've had recently
  • And tides are all over the place this weekend. Lots of spots will have an opportunity to light up:
    • -1' at sunrise
    • 3.5' at lunch
    • 1.5' late afternoon
    • 3' at sunset 
FORECAST:


Karmantine is in full effect next week with plenty of surf. The S swell from the weekend keeps plugging away then we get a shot of more late season WNW swell late Tuesday. Most spots will be head high to overhead on the combo swell. The only fly in the ointment is if the May Gray kicks up our S winds. Regardless, we'll have surf finally. The S will wind down by Wednesday but the WNW will hang around. 


Thursday is a transition day THEN... models show a solid storm taking shape in the southern hemisphere this weekend which, according to the charts, will produce a few swells. If everything goes according to plan, we'll see more head high SW swell late next Friday the 15th and dying around Wednesday the 20th. That's a looooong time. There may also be smaller WNW too. All in all, south swell season is here. 

WEATHER:


Looks like our summer time weather the past week will be replaced by May Gray for the foreseeable future. The fog returned today and will increase through Saturday. By Sunday, a large low pressure system will linger off the Pacific NW. Must be spring. Clouds could hang at the beaches through mid-week. Hopefully the low moves ashore late next week and we get a little more sunshine by next weekend for that next swell. Make sure to check Twitter/North County Surf if anything changes between now and then.
NEWS OF THE WEEK:


Notice how warm our water's been so early in May? Like 5 degrees warmer than normal? Well, the tropical Pacific notices too. If you'll recall, back in late April we had the first tropical depression of the season form. Not that exciting since it was only a depression (39 mph or less winds), but it was the earliest tropical system ever recorded in the eastern Pacific Ocean. Is that an omen for our upcoming hurricane season that runs May 15th through November 30th? I'll get into that in a moment. I'll dig into the details first with the story from Forbes magazine:

The eastern Pacific Ocean made history on April 25th with the formation of Tropical Depression One-E, the earliest tropical system ever recorded in the ocean basin. The premature depression developed about 900 miles off the southwestern coast of Mexico. The depression remained far out to sea and dissipated by Monday without affecting land.

Tropical Depression One-E formed three weeks before the official May 15 start of the eastern Pacific hurricane season. No storm on record has formed this early in the year in the basin, with reliable records here stretching back to the beginning of the satellite era in 1966, according to the National Hurricane Center.

The tropical depression maintained its strength for a few days before dissipating due to wind shear. If it did strengthen though to the 39 mph tropical storm threshold, it would have been named Amanda.


This tropical depression took advantage of a perfect window of opportunity. A tropical wave developed broad rotation within an area of lower wind shear and sea surface temperatures around 80°F (about the minimum temp for formation). A persistent cluster of thunderstorms within the wave allowed a closed center of circulation to take root at the surface and organize the system into a tropical depression.

Hurricane season in the eastern Pacific Ocean doesn't begin until May 15. But the dates that start and end a hurricane season aren't hard cutoffs. These seasonal windows are driven by climatology; the vast majority of storms form within the six-month hurricane season, but some can and do form outside of those dates- as evident by the depression on April 25th- or the latest on December 31st, 2015! Nothing like having a tropical depression form on New Year's Eve. Crazy.

While preseason storms are rare in the eastern Pacific, it’s not terribly uncommon to see early storms over in the Atlantic Ocean. The basin's hurricane season officially begins on June 1, but the last five hurricane seasons—2019, 2018, 2017, 2016, and 2015—all saw their first named storms before June 1. That was an unprecedented stretch for early-season formation in the Atlantic, and it remains to be seen if the basin will continue this streak next month.

Hurricane forecasters have already made their prediction for the Atlantic season and they are expecting above average activity. Good for surfers, bad for homeowners. The Pacific forecast won't come out for a few weeks but early indications are that we're in a neutral phase (neither La Nina or El Nino) so our chances for hurricane surf this summer should be average. As mentioned above though, one positive note is our warmer than normal water temps to start our spring. Our location is too far away to have any effect on hurricane formation of course, but that does mean we may be wearing trunks a month earlier than normal.

BEST OF THE BLOG:


Now that the beaches are opening back up, are you dying to get in the water? One problem though- it's been a while since you waxed up that board, you wore a 4/3 last time out, you can't find your leash, and your local surf shop isn't open yet! No problem, have I got the solution for you- Amazon Surf Shop! From the online retailer that gave you Gas-X delivered to your door within the hour, that hard to find VHS copy of Steel Magnolias, and more fake teeth than you can shake a stick at, Amazon.com has your surf needs. Such products as:
  • Up Surf Wax where the "anti-skid effect is obvious and stable"
  • Future Tri Fins from 'Festnight' that look like FCS fins
  • Leashes that are "stacked with features for the surfer"
  • Surf mats that are "for adults funny and all your jumping family"
  • Traction pads that will make you surf like a beginner
  • Surfing shorts with a "special polishing treatment, feel like peach skin"
  • And a surfboard that if you "take it out in the waves, will be very enjoyable"
Confused? So am I. Don't that let stop you though. Make sure to check out these bitchin' products here! Or just support your local surf shop like you know you should. 

PIC OF THE WEEK:


This is the opposite of Red Tide. Must be nice to see sharks sooner rather than later. 

Keep Surfing,

Michael W. Glenn
Vanquisher
My 1st Girlfriend Was Named Karmantine
Certified Big Wave Trainer