Thursday, December 27, 2018

THE Surf Report- Early Edition


My New Year's Resolution: Surf more! And then surf again.

SURF:


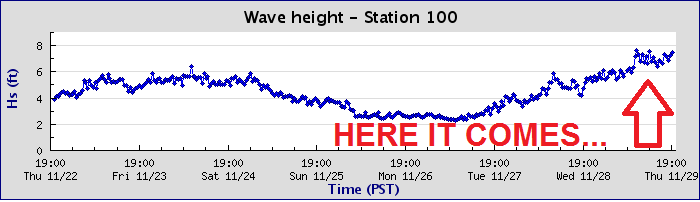
Been one heck of a way to close out the year. Lots of surf the past few weeks, a few windy/rainy days, and my arms are about to fall off from all that paddling. Well worth it though. Today we had a continuation of WNW swell, semi-clean conditions, and manageable crowds. We had a weak cold front move through Nor Cal today and the resulting swell picked up our NW again down here. Tonight we have peaking head high sets and that will start to back off on Friday to the chest high+ range. For Saturday/Sunday, we're looking at waist to chest high surf for the weekend and clean conditions. Not exactly flat but not exactly the firing surf we've had lately.


Water temps are holding at 60 degrees and tides this weekend have mellowed out- we're back to 3' at sunrise, down slightly to 2' mid-morning, and back to 3.5' late afternoon.

FORECAST:


We've got some NW windswell/groundswell action filling in for Monday and beaches should have head high sets again. After that, things start off quiet for the new year with only waist to chest high NW most of next week. High pressure is the culprit and is blocking our storms in the Pacific. The Pasadena Chamber of Commerce likes it, but we don't.


We get another shot of chest high NW towards next Thursday the 3rd and maybe a better head high WNW around Sunday the 6th. And clean conditions with no rain in sight (or big surf).

WEATHER:


As mentioned above, high pressure is in control and any shot of rain is going up and over California. Models are showing offshore winds towards Tuesday and mild conditions most of next week. No complaints- we've received our fair share of rain lately- but hopefully we'll get back into a wet pattern towards the 2nd week of January. Until then, enjoy the sunshine and get outside! Make sure to keep track of the waves and weather at Twitter/North County Surf. 

BEST BET:
Mainly chest high surf tomorrow, New Year's Eve, the 3rd, and possibly the 6th. Nothing too exciting to report.

NEWS OF THE WEEK:


If you haven't noticed, it's warm and getting warmer. Last month in fact was the fifth hottest November on record for the globe. 2018 year to date is also coming in as fourth hottest for planet Earth, according to scientists with NOAA’s National Centers for Environmental Information. Here's highlights from NOAA’s latest monthly global climate report:

The average global temperature in November 2018 was 1.35 degrees F above the 20th-century average of 55.2 degrees. This was the fifth-highest temperature for November (tying with 2004 and 2016) in the 139-year record (1880–2018). November was also the 42nd consecutive November and 407th consecutive month with global temperatures above average.

The year to date | January through November:
The January-through-November period (YTD) average global temperature was 1.39 degrees F above the average of 57.2 degrees. This is the fourth highest YTD on record. Europe had its hottest YTD since continental records began in 1910, posting a continental temperature of 3.24 degrees F above average.

More noteworthy facts and stats:
A three-month heat spike: The period from September through November was the second warmest on record for the globe, with a temperature of 1.44 degrees F above average. Each continent, except North America, hit a temperature that ranked among the eight warmest on record for the three-month period.

Polar sea-ice coverage remains smaller than average:
Average Arctic sea ice coverage (extent) in November was 8.4 percent below the 1981–2010 average, the ninth smallest for November on record. However, Arctic sea ice extent increased faster than average for polar regions in the Northern Hemisphere. The Antarctic sea ice extent was 5.6 percent below average, the second smallest for November on record.


November on the other hand served up a meteorological mixed bag for the contiguous United States: Massive, deadly wildfires devastated entire communities in California and an early season blizzard hit the Midwest, while cool temperatures prevailed east of the Rockies and record rains fell in the East. Here's what happened in the good ol' U.S. of A. last month:

The average November temperature across the contiguous U.S. was 40.1 degrees F (1.6 degrees below average), ranking it among the coolest third of the 124-year record for November. States from the Great Plains to the East Coast had below average temperatures, while the West Coast and Florida, experienced above-average temperatures, according to scientists with NOAA’s National Centers for Environmental Information.

The average precipitation for November was 2.64 inches (0.41 above average), ranking it among the wettest third on record. Parts of the Mid-Atlantic and Northeast had record precipitation, while parts of the Northwest, Southwest and Southern Plains were drier than average.

The year to date and meteorological autumn:
It was the second-wettest meteorological autumn (September through November) on record for the contiguous U.S., with a precipitation total of 9.61 inches (2.73 inches above average). The average temperature for autumn was 53.8 degrees F (0.2 degrees above average), which ranked near the average of the 124-year record.

The average U.S. temperature for the year to date (January through November) was 55.2 degrees F (1.4 degrees above average) – the 16th warmest YTD on record. Average precipitation during this same period was 31.31 inches (3.72 inches above average), making it the fifth-wettest year to date on record.


Other notable highlights:
Raging wildfires in California caused catastrophic destruction and loss of life: The massive Camp Fire burned more than 153,000 acres in Northern California, claiming the lives of at least 88 people (as of this publication date) and destroying more than 18,000 structures. The Woolsey Fire killed at least three people and burned down more than 1,500 structures.

Record rainfall for 7 states: It was the wettest autumn on record for: Maryland, New Jersey, North Carolina, Rhode Island, Texas, Virginia and West Virginia.

States saw a record-breaking year to date: Eight states had record high year-to-date precipitation totals, while 13 states across the East and West had a top-10 warmest YTD.

Long story short- it's never a dull moment around here and won't be for awhile I'm guessing.

PIC OF THE WEEK:


I guess there's more to Peru than just Chicama.

Keep Surfing,

Michael W. Glenn
Front Runner
Found Out I'm 188,778,709th In Line To The Throne
Drive A Big Rig For A Living Just In Case I Come Across Barrels So Big I Could Drive A Mack Truck Through Them

Thursday, December 20, 2018

THE Surf Report- Early Early Edition


It keeps going and going and going...

SURF:
I must have made Santa's 'Nice' list because I've been getting a lot of surf lately. Not sure what I did to deserve this, but I'll take it.


In case you were sleeping the past week, we had solid 10' surf with double overhead sets and bigger waves in SD. 


Yesterday calmed down to a more manageable head high range and was reinforced with a new NW today. That will back off slightly on Friday with shoulder high sets then we get another small shot of NW for shoulder high surf again on Saturday. By Sunday the groms finally get back in the action with chest high sets and we can all take a breather. All in all a fun weekend of easier surf. 


Water temps have dropped to a winter-like 60 degrees and tides are starting to get extreme this weekend with 6.5' at breakfast and -1.5' late afternoon. That's an 8' tide swing- plan your sessions accordingly. 

FORECAST:


Monday starts off with chest high sets then we get a slow rise late in the day from a new NW. As it fills in more on Tuesday though, models show a cold front sweeping through on Xmas Day. This will most likely be more of a wind than a rain maker and as it heads ashore, the storm surf will pick up quickly through the day. Look for 8'+ windy sloppy conditions late in the day and unrideable. Wednesday will start to clean up with dying head high waves in the AM. 

Thursday is clean and chest high then another weak cold front comes through next Friday for head high+ sloppy conditions. Forecast charts then show us getting back on track with a new NW groundswell around the 30th for head high surf. Looks like a mixed bag next week with off and on conditions. 

WEATHER:


Looks like a nice cool weekend to get your last minute shopping done for me (hint) then the above mentioned cold front moves in on Christmas. Various models have showers associated with this system and others have it just being windy. Regardless, look for a chance of a White (i.e. Wet) Christmas with a slight chance of showers and breezy. We get a break on Wednesday/Thursday with sunny/cool conditions then a potentially wetter storm arrives late next week. Models show it being fairly week but we should have more showers than the Christmas Day system. After that- who knows- but it does look like we'll be back to a more active pattern. Make sure to keep track of the waves and weather at Twitter/North County Surf. 

BEST BET:
Just like the stock market recently- it's tough to call. Due to the cold fronts next week, some days could be windy, others could be clean. If I was a betting man (which I'm not since it's illegal in CA), I'd say today, late Monday (before the cold front arrives), late Wednesday (once the Xmas system moves through), and late next weekend (if the models hold up).

NEWS OF THE WEEK:


All this El Nino fueled waves and weather have been a great start to our winter season. But hold on- we're not in a true El Nino event yet! Amazingly, all this activity is just a good start to a normal fall/winter. Seems had to believe, but it takes two to tango- and in the case of an El Nino- that means the oceans and atmosphere need to work together to kick an El Nino into gear. Right now only one of them are co-operating. I'll let the National Oceanic and Atmospheric Administration explain:
  
The surface of the tropical Pacific Ocean is nice and warm, but the atmosphere just doesn’t seem interested. Will these two crazy kids get in sync and qualify as El Niño conditions? Forecasters think there’s a 90% chance that will happen soon and continue through the winter.

Following our “Is it El Niño conditions?” decision tree, once we have a monthly average surface temperature anomaly in our  El Niño   region above 0.5°C (currently near 1.0°C), and it’s forecast to stay that way for the next several months (it is; more on that later), we need signs of an atmospheric response before we can change our relationship status to “El Niño Advisory.”

While warmer-than-average surface waters in the equatorial Pacific are an essential element of El Niño, the atmospheric response is just as critical. In the case of El Niño, those warmer-than-average waters in the central and eastern Pacific warm the air above them, leading to more rising air, clouds, and rain. So much more rising air, in fact, that the entire circulation over the equatorial Pacific— is changed.

The average circulation is driven by strong rising air over Indonesia, leading to west-to-east winds aloft, sinking air over the Eastern Pacific, and returning east-to-west winds (the trade winds) near the surface of the Pacific. More rising air in the central and eastern Pacific weakens this circulation, slowing the trade winds along the surface. Like any good partner, the slower trade winds help to sustain El Niño, keeping the surface waters warmer.


What’s distracting the atmosphere from settling down with the ocean into El Niño? Perhaps it’s a subseasonal dalliance! (Yep, I’m going to torture this metaphor. Buckle in.) We’ve covered The Madden-Julian Oscillation (MJO) a few times before in this space. The MJO is a major area of rising air, clouds and rain (“enhanced convection,” if you’re feeling frisky) that moves eastward along the equator, affecting global atmospheric circulation. It can circle the globe in about 4­–6 weeks. The MJO has been active over the past few months, circling the Earth a few times since September. When the MJO-related area of enhanced convection moves from Africa to the Indian Ocean and through the Pacific, it changes the winds and cloud patterns in the areas we monitor for El Niño conditions. The MJO is a subseasonal pattern, meaning it affects conditions on timescales of a few weeks. Recently, most of the changes we’ve observed in the atmospheric circulation over the tropical Pacific look MJO-related, changing from week to week.

ENSO, on the other hand, is a seasonal pattern, meaning it lasts for several months in a row. We’ve already observed a season of above-average tropical Pacific surface temperature and expect it to continue through the spring. When the atmospheric response to the warmer-than-average waters has kicked in, those signature changes (the weak-in-the-knees Walker circulation) will lock in for the long haul.  The consistent changes in the atmospheric circulation are how El Niño affects global weather and climate patterns. There’s a 90% chance that El Niño conditions will form soon and last through the winter, with a 60% chance it will last through the spring. Why are forecasters confident that these two are destined for each other? Most climate models predict that sea surface temperatures will remain higher than the El Niño threshold (0.5°C above average). Adding support to this is that the amount of warmer-than-average water under the surface is still quite high, although slightly decreased from last month (the November average tied for sixth highest since 1979). This will provide a source of warmer-than-average water for the surface over the next few months.

It’s likely that the tropical Pacific Ocean will keep nudging the atmosphere and the two will get in gear finally, resulting in a true  El Niño. So until then, enjoy the good start to our winter and be ready for bigger and better things. 

PIC OF THE WEEK:


Not sure which I want to stare at more- that long right sandbar point or all the colors. I choose both. 
 
Keep Surfing,

Michael W. Glenn
Coach 
Have A Bowl Game Named After Me
Asked Santa For A 9'0" Rhino Chaser But He Can't Fit It In His Bag

Thursday, December 13, 2018

THE Surf Report- Early Edition


Swell of the century! 

SURF:


Good NW swell mid-week has been replaced by smaller but still fun surf today. For Friday the fun NW holds in the chest high range and the weather stays clean. 


For Saturday, we get another fun boost of NW swell for shoulder high waves. That lasts into Sunday. All in all a fun weekend of surf. Our water temps are still low 60's and tides the next few days are mellow- 3.5' at sunrise, down to 2.5' mid-morning, back up to 3.5' mid-afternoon and yep- you guessed it- down to 2.5' at sunset.  

FORECAST:


Ok- by now you've heard about the 'Swell of the Century' headed our way for Monday- they may run the Maverick's contest- break out your mini gun- blah blah blah. Well, the storm tonight is still in it's early stages off Japan and is forecasted to peak in strength on Saturday with 50' seas. Pretty solid- but not the biggest ever. On a serious note- it's still going to be solid. Surf should start building on Monday and by sundown, expect to see double overhead+ sets at the best North County spots and 15'+ in SD. By Tuesday morning, the swell will be on it's way out, but we'll still see the odd 10' set with double overhead sets in SD in the AM. One minor nuisance may be a weak cold front coming through on Monday evening which could bring a little SW wind bump. 


Wednesday looks to be shoulder high then another good swell arrives late Thursday/early Friday for overhead surf. 


Next weekend looks to be in the chest high range and then models show a smaller storm forming that should give us shoulder high+ waves again Christmas Eve. In summary- plenty big late Monday, solid swell late Thursday, and fun surf Christmas eve. A good way to end the year. 

WEATHER:


Great weather this weekend with just a few high clouds above. A weak cold front moves by to our N on Monday and we may get a shot of showers in Southern California. High pressure sets up behind it and most of next week looks sunny and warm with mild Santa Anas until at least Christmas Eve. Make sure to keep track of the waves and weather at Twitter/North County Surf. 

BEST BET:
If you're up for a challenge- late Monday. If you're a mere mortal (like me)- late Thursday with good overhead surf. 

NEWS OF THE WEEK:


I've been reporting for the last decade or so that as global warming keeps ramping up, we tend to get more extreme weather events. So instead of a winter around here with nice steady rain every week or so, we get a deluge of 2", then weeks of sunny weather. The journal of American Geophysical Union did a study recently that showed half of the world's measured precipitation that falls in a year, amazingly falls in just 12 of those days. In laymen's terms, something like Hurricane Harvey that dumped 40" of rain in Houston, that's a big reason for all that rain in just 12 days.

By century's end, climate models project that this lopsided distribution of rain and snow is likely to become even more skewed, with half of annual precipitation falling in 11 days. Previous studies have shown that we can expect both an increase in extreme weather events and a smaller increase in average annual precipitation in the future as the climate warms, but researchers are still exploring the relationship between those two trends.

"This study shows how those two pieces fit together," said Angeline Pendergrass, a scientist at the National Center for Atmospheric Research (NCAR) and the lead author of the new study. "What we found is that the expected increases happen when it's already the wettest -- the rainiest days get rainier." The findings, which suggest that flooding and the damage associated with it could also increase, have implications for water managers, urban planners, and emergency responders. The research results are also a concern for agriculture, which is more productive when rainfall is spread more evenly over the growing season.

Scientists who study extreme precipitation -- and how such events may change in the future -- have used a variety of metrics to define what qualifies as "extreme." Pendergrass noticed that in some cases the definitions were so broad that extreme precipitation events actually included the bulk of all precipitation. In those instances, "extreme precipitation" and "average precipitation" became essentially the same thing, making it difficult for scientists to understand from existing studies how the two would change independently as the climate warms.

Pendergrass wanted to find something even simpler and more intuitive that could be easily understood by both the public and other scientists. In the end, she chose to quantify the number of days it would take for half of a year's precipitation to fall. The results surprised her. "I would have guessed the number would be larger -- perhaps a month," she said. "But when we looked at the median, or midpoint, from all the available observation stations, the number was just 12 days."

For the analysis, scientists used data from 185 ground stations for the 16 years from 1999 through 2014, a period when measurements could be validated against data from the Tropical Rainfall Measuring Mission (TRMM) satellite. While the stations were dispersed globally, the majority were in North America, Eurasia, and Australia. To look forward, the scientists used simulations from 36 of the world's leading climate models that had data for daily precipitation. Then they pinpointed what the climate model projections for the last 16 years of this century would translate to for the individual observation stations. They found that total annual precipitation at the observation stations increased slightly in the model runs, but the additional precipitation did not fall evenly. Instead, half of the extra rain and snow fell over just six days. This contributed to total precipitation also falling more unevenly than it does today, with half of a year's total precipitation falling in just 11 days by 2100, compared to 12 in the current climate.

"While climate models generally project just a small increase in rain in general, we find this increase comes as a handful of events with much more rain and, therefore, could result in more negative impacts, including flooding," Pendergrass said. "We need to take this into account when we think about how to prepare for the future."

PIC OF THE WEEK:


Population of Indonesia: 250 million. Number of surfers in this photo: 0. Where the heck is everybody?!
 
Keep Surfing,

Michael W. Glenn
Boss 
Got My Own Fan Club!
The Surfer's Surfer

Thursday, December 6, 2018

THE Surf Report- Early Edition


'When It Rains It Pours' part II

SURF:
Wet, windy, and woolly. Whatever you call it, we're getting drenched.


Surf was small the past couple days and as it picked up slightly today, the chocolate brown water and S winds kicked in. Got some peaking shoulder high sets tonight but dirty water unfortunately. As the storm exits the region tomorrow, the surf goes with it. Look for chest high sets tomorrow, waist high on Saturday, and flat on Sunday. At least the weather will be nice.


Water temps are low 60's due to the all the storm activity lately and tides the next few days are around 6' at breakfast and down to -1' late afternoon. 

FORECAST:
Looks like the storm track is going to start retreating N next week and as it does, we'll get more northerly swells and less rain.


First up is a storm that should move through the Pacific NW on Monday and we'll just get the tail end down here late Monday/early Tuesday. As it moves through, look for a pick up from the NW late Monday with shoulder high sets and a little bit of SW wind again. High pressure should set up behind that for clean conditions and a couple more swells on it's heels- a chest high NW next Friday and a chest high+ WNW around Monday the 17th. Nothing big but clean and fun.

WEATHER:


Another solid storm the past few days brought OC beaches a whopping 3-4" of rain, Oceanside 2", and over an inch in Encinitas. We should have a couple more showers tonight but expect sunny skies tomorrow. Nice cool sunny weather is setting up for the weekend then a weak cold front arrives late Monday. We may get a 1/4" out of it which is a drop in the bucket compared to our last 2 storms. For the 2nd half of next week, high pressure sets up and we'll have typical beautiful Southern California weather- for December no less. Make sure to keep track of the waves and weather at Twitter/North County Surf. 

BEST BET:
Most likely next Friday the 14th and Monday the 17th as our storms should be gone and we're back to sunny skies and cleaner water!

NEWS OF THE WEEK:


Just a quick refresher course from NOAA on waves and tides since we've had an active pattern out there lately and big 7' tide swings this weekend.

The ocean is never still. Whether observing from the beach or a boat, we expect to see waves on the horizon. Waves are created by energy passing through water, causing it to move in a circular motion. However, water does not actually travel in waves. Waves transmit energy, not water, across the ocean and if not obstructed by anything, they have the potential to travel across an entire ocean basin.

Waves are most commonly caused by wind. Wind-driven waves, or surface waves, are created by the friction between wind and surface water. As wind blows across the surface of the ocean or a lake, the continual disturbance creates a wave crest. These types of waves are found globally across the open ocean and along the coast.

More potentially hazardous waves can be caused by severe weather, like a hurricane. The strong winds and pressure from this type of severe storm causes storm surge, a series of long waves that are created far from shore in deeper water and intensify as they move closer to land. Other hazardous waves can be caused by underwater disturbances that displace large amounts of water quickly such as earthquakes, landslides, or volcanic eruptions. These very long waves are called tsunamis. Storm surge and tsunamis are not the types of waves you imagine crashing down on the shore. These waves roll upon the shore like a massive sea level rise and can reach far distances inland.

The gravitational pull of the sun and moon on the earth also causes waves. These waves are tides or, in other words, tidal waves. It is a common misconception that a tidal wave is also a tsunami. The cause of tsunamis are not related to tide information at all but can occur in any tidal state.

While some places have one high tide and one low tide per day, most coastal locations have two high tides and two low tides a day. These highs and lows typically aren't equal. This is why, in most places, using the phrase "high tide" might be unclear. There's actually high tide and higher high tide (and low and lower low tide).

If the Earth were a perfect sphere without large continents, and if the earth-moon-sun system were in perfect alignment, every place would get two equal high and low tides every day. However, the alignment of the moon and sun relative to Earth, the presence of the continents, regional geography, and features on the seafloor, among other factors, make tidal patterns more complex.

Around the world, there are three basic tidal patterns: semidiurnal, mixed, and diurnal. When both high tides are about equal to each other, and the low tides are also roughly equal, the pattern is called a semidiurnal tide. If the two highs and lows differ substantially, the pattern is called a mixed tide. Where there's only one high and one low tide a day, it's called a diurnal tide. One location can experience different tide patterns throughout the month.

PIC OF THE WEEK:


Sure there's a few cars in the parking lot and a bunch of guys in the line-up, but can you blame them?

Keep Surfing,

Michael W. Glenn
Trailblazer
Thinking of Trying Out For The XFL
Got Tubed, Barreled, Pitted, Kegged, Shacked, and Piped All In One Session

Thursday, November 29, 2018

THE Surf Report- Early Edition


When it rains, it... well, you know the rest. 

SURF:


Wow. Winter hit 3 weeks early today. Gusty 30 mph+ winds, over an inch of rain, and 10' storm surf. Love it! If you've read THE Surf Report over the years, you know I'm not a big fan of boring fog- either it has to be sunny beach weather or batten down the hatches. Looks like I got my wish today with the latter. As far as the surf goes, we haven't had a 'real' rain in about 8 months so the water is REALLY dirty unfortunately and it's probably best to stay out until at least Sunday evening if you dare- or Monday. Not that it's going to be good anyway. 


Currently Point Conception is 20' tonight and down here tomorrow we'll see 10'+ surf from the WNW and strong NW winds. Saturday has sunny skies in the AM and smaller surf but another cold front will sleep through late in the day and early Sunday. Behind that front will be more head high+ WNW windy surf. Not worth getting sick over. Water temps are still mid-60's and tides the next few days are around 4' at breakfast and down to 1' mid-day and up again to 4' at sunset. 

FORECAST:
Early in the workweek starts off slow with only waist high WNW/SW and clean conditions. 


But forecast models show a good storm taking shape this weekend that should give us head high WNW starting late Wednesday and lasting into Thursday morning. On it's heels is slightly bigger storm on the charts early next week which could give us well overhead WNW again next Saturday. All the while, storms next week (see below) may impact the quality of the surf. Plan accordingly.

WEATHER:


Nothin' like a good ol' fashion storm to kick off our rainy season. Most spots along the coast received 1" while the mountains between here and LA received 2-3". Wind was also a factor with this storm as peak gusts along the coast were 40 mph and the mountains had gusts of 70 mph. With the 1/2" of rain we received earlier this month, spots in Southern California now sit between 1.5-2"; which is 100% of normal. Glad to see us on track for once. As mentioned above, we have another weak cold front coming through mid-day on Saturday for maybe 1/4" or rain. Sunday will be cool and breezy while Monday/Tuesday will have sunny skies. Charts show another storm headed our way for Wednesday which may actually take aim at northern Baja so we could only get a glancing blow and 1/2" of rain. But that could all change between now and then. So make sure to keep track of the waves and weather at Twitter/North County Surf. 

BEST BET:
Tough call since all of our swells are accompanied by stormy conditions. But if you must paddle out, try Monday morning with a quickly dying WNW. Or late next Wednesday with new WNW swell and hopefully rain holding off until Thursday! 

NEWS OF THE WEEK:


What the heck is with wild weather happening on November 29th?! If you thought today's weather was interesting, check out what else happened on this date in history...

2006: Offshore winds gusted to 73 mph at Fremont Canyon (sustained 54 mph) and 58 mph at Ontario. Widespread property damage and power outages resulted from downed power lines, poles, and trees.

1997: A pocket of dense fog developed along Interstate 15 near Elsinore. In the span of 45 minutes, seven accidents involving 23 vehicles occurred along a half-mile stretch of the highway, which was closed for five hours.

1991: An intense winter storm swept into the region with strong winds and snowfall. Winds knocked out power to around 60,000 people in L.A. and San Diego. A 62 mph wind gust was reported in the San Fernando Valley. One woman was killed and 3 others were injured in a dust storm related traffic accident. Two hikers were trapped by snowfall on Mt. Baldy for 43 hours, where they survived estimated wind chills as lows as -35⁰F.

1976: It was 32° in Borrego Springs, the earliest date in the season to record a freezing temperature

1975: The first winter storm of season was a heavy one. It started on 11/28 and ended on this day. Up to two feet of snow fell in the San Bernardino Mountains, including 16 inches at Big Bear Lake. Twenty stranded campers were rescued after a few days. It was 17° at Palomar Mountain, the lowest temperature on record for November. This also occurred on 11/16/1964 and 11/16/1958. A 7.2 magnitude  earthquake hit Hawaii on this day, sending a tsunami that hit Santa Catalina Island. In San Diego a 2.4-foot maximum amplitude was measured. Some damage resulted.

1970: A series of storms struck the region from 11/25 to 11/30 following large destructive wildfires in the San Bernardino and San Gabriel Mountains earlier in the fall. 9.17 inches of precipitation fell in Lake Arrowhead, 7.22 inches in Lytle Creek, 5.11 inches in Big Bear Lake, 5.02 inches in Palomar Mountain, 3.56 inches in San Bernardino, 2.63 inches in Redlands, 2.51 inches in Santa Ana, and 2.05 inches in San Diego. Flooding inundated streets and highways in the Rancho Cucamonga area. At least 60 homes were damaged by floods and debris flows.

PIC OF THE WEEK:


As you know, the Hawaiian's measure the size of a wave from it's back. So if you hear it's 4-6' 'Hawaiian', it's really 8-12' for us mortals. On that note, how big would the Hawaiians say this wave was since it doesn't have a back? I guess it was flat out there that day?
Keep Surfing,

Michael W. Glenn
Pioneer
Totally Over Social Media. Going To Start Communicating To My Fans Via Mental Telepathy
2014 World Skimboarding/Bodysurfing/Bodyboarding/Shortboard/Soft Top/Longboard/Big Wave/SUP Champion

Wednesday, November 21, 2018

THE Surf Report- Long Holiday Weekend Edition


Thankful for any amount of rain.

SURF:


We finally got back to normal conditions around here with tame winds, mild temperatures, and small but rideable surf the past few days.


For Thanksgiving, we have increasing WNW swell for chest high surf and maybe the odd shoulder high set by Friday. Unfortunately (as far as surf conditions are concerned), we have a weak cold front moving through the area on Thursday to put some bump on the surf. On Saturday we have more chest high surf from the WNW (and the odd shoulder high set again) and yet another cold front moving through. By Sunday the surf starts to drop and conditions improve. Long story short- some chest high surf this long holiday weekend but bumpy conditions.


Water temps are still mid-60's and tides the next few days are around 6' at breakfast and down to -1' late afternoon. 

FORECAST:
Early in the workweek starts off slow with only waist high WNW/SW and clean conditions.


But charts show a good storm taking shape this weekend that should give us head high+ WNW starting late Wednesday and lasting into Thursday morning.


On it's heels is a smaller but still fun WNW for shoulder high sets around the 1st of December. Looks like we're back on track for real surf. Make sure to keep track of the waves and weather at Twitter/North County Surf. 

WEATHER:


As mentioned above, we have a couple week fronts moving through this weekend to put some bump on our surf and rain in our reservoirs. Look for showers Thanksgiving morning and NW winds by dinner time. Friday morning starts off clean then another weak front comes through late Friday. We'll have NW winds again on Saturday and clean conditions by Sunday. When everything is said and done this weekend, we may get 1/3" to 1/2" of rain. Early next week looks to be your typical Southern California fall: sunny skies, offshores in the AM, and temps in the mid-60's. Long range charts though show the North Pacific kicking back into gear and maybe a shot of rain the 2nd half of next week. Stay tuned.

BEST BET:
Wednesday with solid WNW swell and good conditions (before that next cold front moves through?)

NEWS OF THE WEEK:


Finally some wet weather here in California to help with our wildfires. A drier than normal summer and a late start to our rainy season helped fuel the Camp and Woolsey fires into one of the worst in history. Here's a deeper dive from the National Oceanic and Atmospheric Administration as to why those fires were worse than usual:

Multiple wildfires in northern and southern California have led to tragedy and devastation in November 2018, with an estimated 66 fatalities (as of November 16) and more than 10,000 lost structures. The fires also sent smoke plumes hundreds of miles away, degrading air quality throughout the state. It’s the second year in a row that the state has experienced massive, destructive wildfires.

Unlike locations East of the Mississippi, California’s precipitation is sharply seasonal, with hot, dry summers and wetter winters. A dry start to the current water year in October came on the heels of an even drier-than-average summer. The resulting dried grasses and vegetation provided plenty of fuel for wildfires to grow exponentially should a fire be lit. And in November, 2018, those wildfire powder kegs exploded in both northern and southern California. North of Sacramento, the Camp Fire burned an area of over 70,000 acres in less than a day starting on November 8, taking advantage of incredibly dry atmospheric and ground conditions while strong winds whipped the fire into a frenzy. As of November 14, the fire had burned over 138,000 acres of mostly non-forested land and was only 35% contained. The Camp Springs fire now has the dubious record of being both the most destructive and deadliest wildfire in modern history for California. In southern California, similarly hot, dry and windy conditions helped turn a fire into a raging conflagration in the hills north of Los Angeles. The Woolsey fire also started on November 8 and has burned almost 100,000 acres of mostly grass and shrubs and was 52% contained. The fire has impacted well-known communities north of Los Angeles including Malibu, Calabasas, Agoura Hills, and Thousand Oaks and has burned down over 500 structures as of November 14th. 


How was California primed for wildfires?

Statistically, the risk for wildfires in California in November is very low, with only areas north of Sacramento and across southern California at a small risk for wildfires bigger than 100 acres. This makes sense, as wildfire risk peaks in the hot, dry months of summer and then decreases as the chance of seasonal rain increases. Rains across California peak during the winter months, but on average, precipitation begins to pick up starting in October.

Summer 2018 was much warmer than average across the state—record warm in some places, especially at night—and in Northern California, precipitation ranged from below average to record dry. Precipitation across much of the state was less than 5 percent of average in September, and the summer dry signal extended into beginning of the fall wet season, with below-average precipitation in October as well.

With all the heat and dryness, the ground was dry to start November, with vegetation turned into excellent fire fuel. Then strong winds, including the Santa Ana winds in southern California, roared into town. A high pressure system with clockwise winds settled in to the east of California. This allowed winds to blow in from the east, moving down the coastal mountains of California. The winds then got funneled through natural channels in the mountains, gathering speed as they moved down in elevation. As the winds continued to drop in elevation, they compressed and warmed, drying the air even more.

These winds tend to peak during the winter months but occur during the fall as well. Normally, the wetter conditions during the winter rainy season mean these strong winds don’t act to whip up fires. The moistened grounds reduce the risk of fires even starting to begin with. But if rains are below-average and summer-baked ground remains dry, these winds can help rapidly spread fires even into winter. Both fires saw strong, dry winds blow in from the east as winds gusted to at least 40-50 mph. This rapidly spread the fires and made containment near impossible for firefighters.


Climate Change connection

According to the Climate Science Special Report as a part of the upcoming Fourth National Climate Assessment, the number of large fires has increased from 1984-2011, especially over the western U.S.. These trends are likely from a combination of factors, including previous decades’ fire suppression policies and climate change. Research suggests that global warming will cause an increase in very large fires—greater than 50,000 acres—across the western United States by the middle of the century under both lower and higher greenhouse gas emission scenarios. In the previous U.S. National Climate Assessment, the authors noted that models forecast up to a 74% increase in burned areas in California by the end of the century in scenarios with high greenhouse gas emissions.

This makes sense as warming temperatures due to human-caused climate change will dry out vegetation even more, leaving additional kindling available for fires. To know if (or when) your town is under an increased risk for fire, head to the National Weather Service’s Storm Prediction Center for Fire Weather outlooks here: https://www.spc.noaa.gov/products/fire_wx/

PIC OF THE WEEK:


One of the many things I'm thankful for. Happy Thanksgiving everyone!

Keep Surfing,

Michael W. Glenn
As American As Pumpkin Pie
Never Been Called A Turkey
Thankful For Surfing