Thursday, July 29, 2021

THE Surf Report


I Think We're Stuck In Neutral. 

SURF:


The past week saw us in a holding pattern with just waist high+ surf in SD County (and bigger in the OC of course) as well as SOME sunny days and SOME cloudy days. Winds were light from the NW though and the water temps dropped from a high of 75 degrees 10 days ago to 65 in some places this week. The ocean sure doesn't feel like summer right now. All in all I'd give it 2 out of 4 on the Surf Scale since the waves, water, and weather couldn't cooperate. 


For Saturday, we have another small S swell filling in for waist high+ surf with bigger sets towards the OC again. Looks like the weather should at least cooperate this weekend with more tropical clouds overhead. And here's the tides, sun, and water temps for the next few days:
  • Sunrise and sunset:
    • 6:02 AM sunrise. 
    • 7:47 PM sunset. 
  • And water temps are struggling in the mid-60's with all the NW wind the past few days...
  • And tides aren't that dramatic this weekend:
    • 3' at sunrise
    • 2' mid-morning
    • 4.5' late afternoon
    • and down to 3' at sunset
FORECAST:


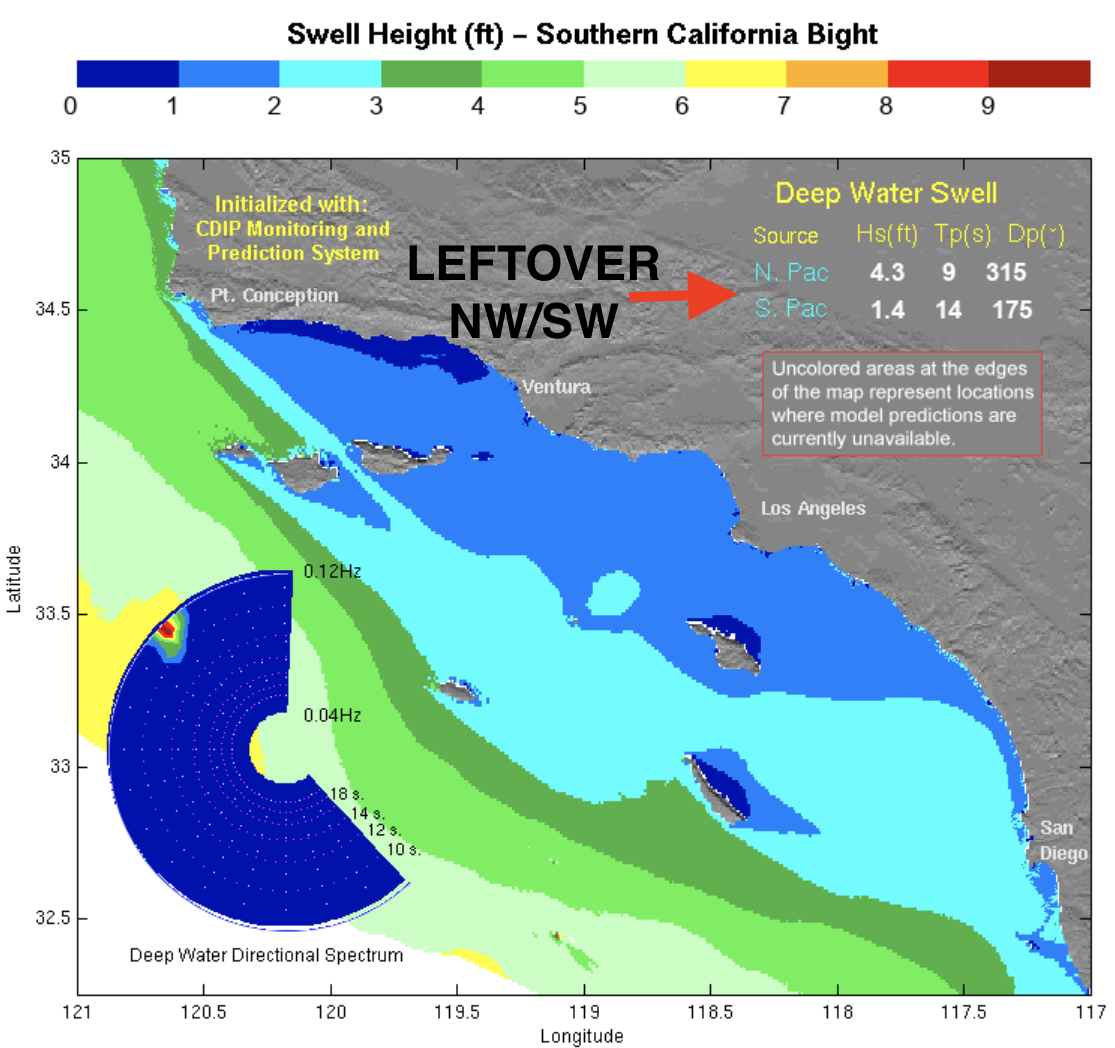
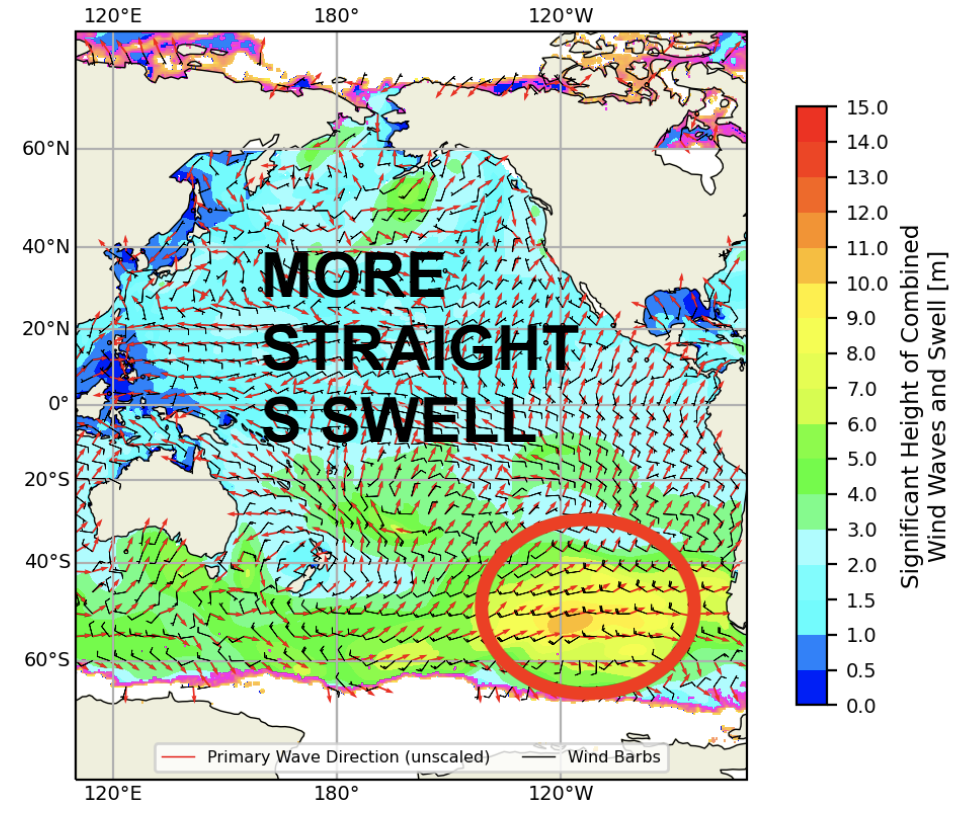
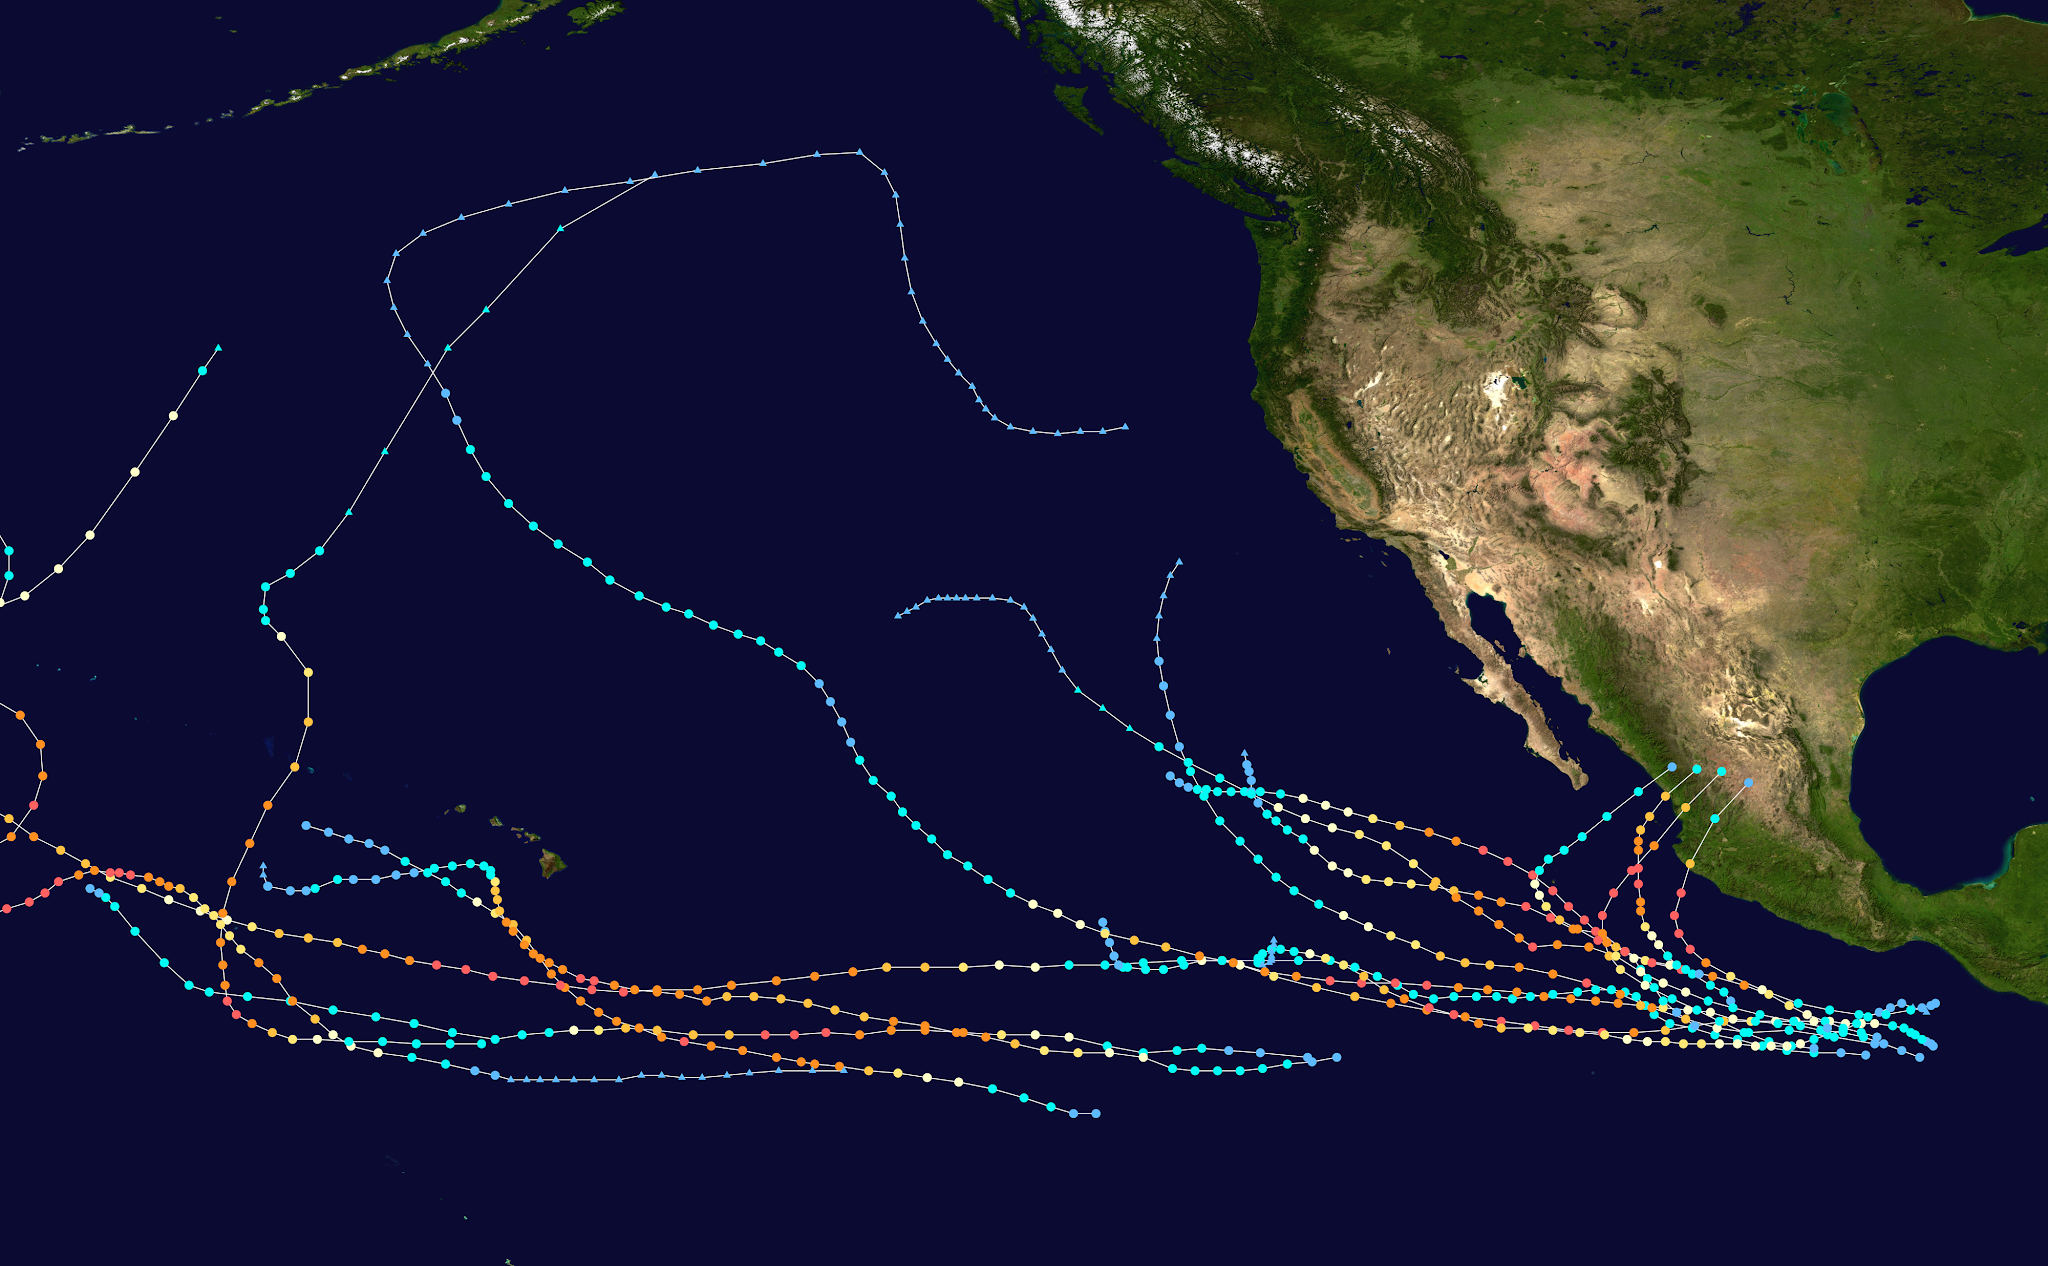
A moderate storm off Antarctica formed a few days ago and is sending more SSW our way. Look for inconsistent chest high sets late Monday, consistent chest high surf Tuesday, and the odd shoulder high set Wednesday/Thursday. And the OC? A foot bigger as usual this time of year. The tropics are trying to get their act together this weekend but to this point have been a non factor during this La Nina summer. My best guess when we'll see big surf again? November? Just kidding! Most likely October. 

WEATHER:


If you're looking for excitement the next few days, don't head to the ocean, head to the mountains. We've got another round of monsoon moisture making its way from the desert SW and expect to see thunderstorms out there through the weekend. At the coast? MAYBE a stray cloud overhead. Temps will be mid 60's at night and mid-70's during the day. Pretty darn perfect. If anything changes between now and then, make sure to follow North County Surf on Twitter!

BEST BET:
Looks like Tuesday-Thursday with new fun SW swell. Clear your schedule! Can't believe I'm excited for chest high surf. 

NEWS OF THE WEEK:


If bigger storms and rising sea levels weren't already a problem, now the moon is trying to get into the act. Supposedly it's 'wobbling' and that may affect our tides in the near future- and not in a good way. Gulp. Here's Popular Mechanics to explain:

Thanks to rising sea levels and a wobble in the moon's orbit, the 2030s will be marked by a record number of high-tide floods around the coastal United States, scientists warn in a new paper. 

So-called "nuisance floods" occur when tides rise between 1.75 and 2 feet above the daily average high tide, according to the= National Oceanic and Atmospheric Administration (NOAA). These kinds of floods may not be as extreme as those caused by hurricanes or other natural disasters, but they can still cause water to back up into basements and gurgle from sewage drains.

NOAA reports that more than 600 nuisance floods occurred in the U.S. in 2019, and between May 2020 and April 2021, coastal communities saw twice as many high tide flooding days than they did 20 years ago. But new NASA-led research—published last month in the journal Nature Climate Change—suggests the trend will only grow more dramatic in the 2030s. 


Expect to see three to four times more high-tide flood days than at present, all concentrated in the space of a few months of activity each year. Floods may even occur in clusters that last a month or longer, leaving cities along the east and west coasts to deal with floods every day or two, according to NASA. 

"It's the accumulated effect over time that will have an impact," lead study author Phil Thompson, an assistant professor at the University of Hawaii, says in a NASA press release. "If it floods 10 or 15 times a month, a business can't keep operating with its parking lot under water. People lose their jobs because they can't get to work. Seeping cesspools become a public health issue."


Climate change, and the rising sea levels that come along with it, is only partly to blame. In fact, the main factor is a "wobble" in the moon's orbit that regularly occurs every 18.6 years. The wobble isn't new (it was first reported in 1728, according to NASA), but combined with the effects of climate change, it will create an unprecedented series of high-tide flooding. 

To understand the significance of this wobble, let's first unpack the moon's relationship with the ocean's tides. The moon physically pulls on the oceans via gravity (for that reason, the sun also affects the tides, although less noticeably), causing high and low tides. High tide, when the ocean's fluctuating level is at its most elevated, can already cause problems in coastal towns. It can cause backflow in rivers that empty into the ocean.

A couple of times each month, high tides are made even higher by the combined factors from Earth, the sun, and the moon. These are called spring tides, and they also mean lower low tides—more extremes in both directions. But spring tides are just one way the high tide varies over time, NASA explains. 


Let's return to that moon wobble. The moon suppresses tides on Earth for half of the 18.6-year cycle, meaning high tides are lower than normal, and low tides are higher than normal. But during the other half of the time, the tides are amplified. We're in the latter period of the moon's cycle at the moment, but the sea level hasn't risen enough yet from climate change for the effect to be compounded—yet. 

The next time we're on the amplified side of this moon cycle, however, the combined higher sea levels and rising tides will cause a record number of nuisance floods along all of the mainland coastlines in the U.S., as well as in Hawaii and Guam. 

As an example, the new paper highlights St. Petersburg, Florida, which is in the relatively low-lying Tampa Bay area. The researchers forecast just six "minor flooding" days per year between 2023 and 2033—a number that jumps to 67 days per year between 2033 and 2043. For La Jolla, California, the number jumps from one to 49 days per year. For Honolulu, Hawaii, it leaps from two to 63 days per year. 

By 2030, the sea level will have risen by an estimated minimum of 1.4 inches, according to the Royal Society, the U.K.'s national academy of sciences. By 2039, that number will be more like 2.7 inches minimum. That, combined with the wobble effect, could leave beach communities at odds with nature, necessitating some serious infrastructure changes. Let's hope stakeholders will take this new report seriously.

PIC OF THE WEEK:


Never been a big fan of cruise ships. Sure there's 'Vegas' style entertainment, buffets 'til you explode, some pretty intense shuffleboard matches, and you may be get a new disease named after you. But my main problem is the time it takes to get to your destination. Why spend a week cruising on the open ocean when all I really want to do is spend a week on this wave instead? Guess I'm not getting hired at Carnival Cruise Line anytime soon?...

Keep Surfing, 
Michael W. Glenn
Always On Time
Well I'll Be A Monkey's Uncle
Copper Medalist, Surfing, 2020 Olympic Games

Thursday, July 22, 2021

THE Surf Report


Everything But The Kitchen Sink. 

SURF:


Pop quiz! What did you witness the past week?:
  1. Warm 76 degree water
  2. Tourists in a crowded line up
  3. Small southern hemi surf
  4. Low clouds and comfortable air temps
  5. Cooler 69 degree water (or even 61 in Long Beach)
  6. Thunder & lightin'
  7. Rideable tropical storm surf
  8. Sunny warm humid skies
  9. Touch of NW windswell
  10. The kitchen sink
If you said all of the above, congratulations! Or even a pat on the back. How about a free surf report. Even if you missed some of the above the past few days, there was still more than enough to make your head spin. For the weekend, we've got more SW on the way for Saturday/Sunday with waist to chest high surf again. Along with tropical clouds overhead, and pleasant water temps, should be a fun weekend. And here's the tides, sun, and water temps for the next few days:
  • Sunrise and sunset:
    • 5:58 AM sunrise. 
    • 7:52 PM sunset. 
  • If you probably noticed, water temps to start the week were 75. Then we had some WNW winds mid-week, and they dropped to 69 (Long Beach dropped a whopping 10 degrees in 4 days to 61). SW winds were blowing today though, so we should be back to low 70's by Sunday.
  • And heads up on the tides this weekend:
    • -1' at sunrise
    • 4' at 11 AM
    • 2' mid afternoon
    • and up to 6' at sunset
FORECAST:
The new SW over the weekend rolls into Monday with more waist to chest high surf. 


Mid week looks to be waist high plus and then models show another small swell taking shape this weekend in the southern hemisphere which could give us more chest high SW around Thursday/Friday. Still nothing big but tropical skies and warm water is nothing to sneeze at. 

WEATHER:


This is my 2nd favorite time of the 'weather year'. My favorite? Big storms during our winters. This time of year though is a close 2nd with all the monsoon moisture streaming from the Gulf of California/desert SW into southern California. For the weekend, temps will be on the mild side (low 70's) but we'll have plenty of tropical clouds and a chance of showers again late Sunday into Monday. The 2nd half of next week sees more low clouds/fog in the nights/mornings and less humidity. If anything changes between now and then, make sure to follow North County Surf on Twitter!

BEST BET:
This weekend with fun surf, manageable water temps, and tropical clouds overhead. Does anyone even remember May Gray around here?...

NEWS OF THE WEEK:


On a calm day in the ocean, ever notice those little sand berms on the seafloor made by the gently surging waves? Researchers have found them under Louisiana, when the ocean was 200' lower about 65 million years ago. 'Who cares' you say? What if I told you they were 'megaripples', over 50' high and 2,000' feet apart. What kind of enormous waves would create such a pattern on the ancient seafloor? Most likely the asteroid that killed the dinosaurs. Here's more from the Smithsonian:


Some 66 million years ago, a huge space rock about the size of Manhattan slammed into Earth near the Yucatan peninsula. The enormous asteroid sent huge blasts of dust and waves rippling across the planet and wiped out up to 75 percent of life, including dinosaurs.

Now, scientist say they have found evidence of the resulting giant tsunami that swamped much of the Earth. In a study published in the journal Earth & Planetary Science Letters, researchers report how they discovered 52-foot-tall “megaripples” nearly a mile below the surface of what is now central Louisiana.

According to the paper, these megaripple features have average wavelengths of 600 meters (1,968.5 feet) and average wave heights of 16 meters (almost 52.5 feet) making them the largest ripples documented on Earth.

Led by Gary Kinsland, a geoscientist at the University of Louisiana, the research team found fossil records of the huge waves in sediment 5,000 feet below the surface. They used seismic imaging data provided by oil and gas exploration companies to locate the geological features.

Kinsland is convinced these fossilized remains were left behind by the megaripples as they neared what was then the coastline. At the time, the area was about 200 feet below the surface of the ocean, he tells Akila Raghavan of Science Magazine. “The water was so deep that once the tsunami had quit, regular storm waves couldn’t disturb what was down there,” Kinsland says.
The researchers found a series of megaripples spaced about a half-mile apart preserved in sediment, including shale formations, that settled on the site, reports geologist David Bressan in Forbes Magazine.

He writes “The researchers argue that the megaripples are the results of a series of impact-induced tsunami washing up an ancient seashore. The thick sand-layers deposited by the uprush and backwash currents of the tsunami waves formed symmetrical ripples on the seafloor.”


Kinsland and his colleagues selected central Louisiana as a search site because that’s where they suspected the shoreline was 66 million years ago, a time when water levels were much higher. The dinosaur-killing asteroid left a nearly 100-mile wide crater on the floor of the Gulf of Mexico, near the modern community of Chicxulub on the Yucatan peninsula, reports Tessa Koumoundouros for ScienceAlert.

The researchers determined the megaripples corresponded accurately to the crater in the Gulf of Mexico. The circumferences of the geologic features in Louisiana match up with the impact site, Kinsland tells Raghavan.

The study builds on past research about the impact of the asteroid near Chicxulub. In 2016, cores from a drilling expedition determined how the crater was formed. Two years ago, scientists located a fossil site in North Dakota that included debris swept inland by the tsunami.

“We have small pieces of the puzzle that keep getting added in,” Alfio Alessandro Chiarenza, a paleontologist at the University of Vigo, tells Raghavan. “Now this research is another one, giving more evidence of a cataclysmic tsunami that probably inundated [everything] for thousands of miles.”

PIC OF THE WEEK:


Looks like a pretty good channel to paddle out in in the bottom left of the image. But the water is also starting to drain off the reef. First question you should ask- where's the nearest hospital? Just in case. 

Keep Surfing, 
Michael W. Glenn
Focused
Big Fan Of Wax Museums
Kealoha, Bourez, Sarlo, Cram, Poto, Hakman, Gomes, Elkerton, and Glenn

Thursday, July 15, 2021

THE Surf Report


Summertime And The Livin's Easy

SURF:


Having fun yet? These past few weeks have been a 4 out 4 on my 'Surf Scale' (patent pending). We've had:
  1. Waves
  2. Manageable winds
  3. Warm water
  4. Sunshine
Looks like the near term will be a 3 out of 4 (lack of solid swell) and maybe a 4 out of 4 in the long term (more on that in the forecast below).


For the weekend, we have a new small S swell filling in on Friday with a continuation of waist high surf mid SD County for the weekend, chest high sets in far N SD County, and the odd shoulder high wave in the OC. And here's the tides, sun, and water temps for the next few days:
  • Sunrise and sunset:
    • 5:53 AM sunrise. 
    • 7:56 PM sunset. 
  • Water temps are feeling fantastic at 72-74 degrees.
  • And tides are only an issue late afternoon this weekend:
    • 2.5' at sunrise
    • up slightly 1.5' mid morning
    • 5' late afternoon
    • And back down to 3' at sunset
FORECAST:


Still no big surf on the horizon, but we do have a new fun SW swell arriving Wednesday for chest high surf and shoulder high waves in the OC. That should last mid-week. 


There's also a chance of hurricane Guillermo forming this weekend- and if it does- MAYBE a fun chest high swell for us mid-week (and better for the OC of course)? And while we're on the subject hurricanes, Felicia is currently spinning well off SW Baja. 3 problems for us:
  1. Felicia isn't that big
  2. Felicia isn't that strong
  3. Felicia is headed away from us
So don't expect any surf from Felicia. 


For late next week and beyond, the forecast maps haven't looked all that impressive, but there's still storms forming off Antarctica. We should see more chest high SW around Saturday the 24th and Monday the 26th.

WEATHER:


May get a little tropical weather this weekend into next week. High pressure is forecasted to move towards the upper Rockies and as it does, monsoon moisture from the Gulf of California will make its way into our region this weekend. At this time, the mountains, deserts, and MAYBE the inland valleys could see a stray thunderstorm, while the coast could see those awesome tropical clouds overhead. Monday/Tuesday has clearer skies, then the 2nd half of next week, the tropical clouds should return. If anything changes between now and then, make to follow North County Surf on Twitter!

BEST BET:
If you live in the OC, this weekend with nice weather and fun chest high S swell. For the rest of So-Cal, pretty much the 2nd half of next week with fun chest high surf, tropical weather, and warm water. Kind of like Hawaii-lite. 

NEWS OF THE WEEK:


Just when it looked like we'd be in a neutral pattern (or even a small chance of El Nino this winter), La Nina may again rear its ugly head (no offense). Here's the latest from the National Oceanic and Atmospheric Administration (NOAA):

As things stand with the El Niño-Southern Oscillation (ENSO), neutral conditions are currently present in the tropical Pacific and favored to last through the North American summer and into the fall. But forecasters at NOAA’s Climate Prediction Center have issued a La Niña Watch, which means they see La Niña likely emerging (~55%) during the September-November period and lasting through winter.

I know you’re all excited for me to talk about La Niña, but I’m a killjoy, so bear with me for a second while I talk about the current state of the Pacific. In June, ocean surface temperatures were near the 1991-2020 average across the equatorial Pacific, including the all-important Nino3.4 region which we use to monitor the state of ENSO. Specifically, the June sea surface temperature in the Nino3.4 region was 0.25 degrees Celsius below average, well within the ENSO-neutral range. Ocean temperatures in this region have been quickly returning to near-average conditions over the last several months, increasing by nearly half a degree Celsius since April and over a degree Celsius since last winter’s La Niña peak.


But as we have said, so many, many times: there is more to ENSO than just the surface of the ocean. Putting on our snorkels, let’s dive beneath the surface of the Pacific, where things aren’t as near average but still firmly indicative of an ENSO stuck in neutral. Waters were slightly warmer than average, except for the eastern Pacific where cooler-than-average waters developed near the thermocline—the layer of water that marks the transition between the warmer upper ocean and colder deeper ocean. But overall, nothing to write home about.

To finish off this trilogy of signs about our current ENSO-neutral Pacific, we look to the skies! After all, ENSO is a coupled atmosphere/ocean climate phenomenon. And for the past month, that atmosphere has been pretty darn neutral. Winds at both low and high levels of the atmosphere were pretty normal, and while thunderstorm activity was reduced near the dateline, things were mostly average elsewhere.

It might seem odd, then, with things seeming so… blah… that a La Niña Watch has been issued. To clarify, a La Niña Watch means conditions are favorable for the development of La Niña within the next six months. So, what’s in the climate model “tea leaves” that has helped scientists feel comfortable enough to start throwing the La Niña label around?


The answer, in part, lies in a strong computer model consensus. While most of the models we look at predict ENSO-neutral to continue to last through fall, many models from the North American Multi-Model Ensemble (NMME) favor a transition to La Niña during the fall and into winter. The NMME is incredibly helpful to forecasters in predicting the future state of ENSO, especially when we are past the notorious spring barrier, a time when model accuracy wanes.

Is it all that unusual to have two La Niña winters back-to-back? Nope! In fact, of the twelve first-year La Niña events, eight (!) were followed by La Niña the next winter, two by neutral, and two by El Niño. Honestly, with those numbers, it would have been more surprising if we thought neutral conditions would continue all year.

Putting all of those 12 first-year La Niñas together with 2020-2021, it’s evident how much this last year doesn’t stand out. Though, twelve past cases are not a ton to rely on by itself. This La Niña Watch is buoyed by much more than that.


One specific reason why and when any change to ENSO is important is the potential influence on the Atlantic and eastern Pacific hurricane season. As noted on the ENSO Blog in the past, La Niña can help make atmospheric conditions more conducive for tropical cyclones to form the Atlantic, and less conducive in the Eastern Pacific. If 2021 so far is any indicator, it could be an active year: through the beginning of July, five named storms in the Atlantic have already formed, a new record—breaking the previous record set just last year. In August, the Climate Prediction Center will issue an updated hurricane outlook, so stay tuned for more info on that. 

So what does that mean for Southern California? Could be a repeat from last winter since La Nina was also in charge:
  • Below average rainfall
  • Colder air temps
  • Colder water temps
  • Most likely below average surf
  • Periods of consistent swells then dry spells for awhile
If last winter's surf is any indication, we didn't see any monster surf and it was off and on- we saw stretches of fun/good surf and stretches of NO surf. Oh well. 

PIC OF THE WEEK:


Last week was a right point, this week it's a left. Goofies rejoice! 

Keep Surfing, 
Michael W. Glenn
Decision Maker
Emmy Snub
US Olympic Surf Team (Board Caddy)

Thursday, July 8, 2021

THE Surf Report


If You Love Summer, Raise Your Hand!

SURF:
Just like I'd been saying for months now- sunny, fun surf, warm water, and light winds. (Don't you know sarcasm when you hear it Charlie Brown?) 


Anyway, it was worth the wait. Summer finally arrived and conditions came together for the 4th. Surf dropped slightly the past few days, but we still had plenty of everything to go around. 


For this weekend, we get a small reinforcement out of the S to keep us in chest high waves along with warm water, partly sunny skies, and manageable winds. I love summer. (I also like stormy winter days but that's a story for another time). And here's the tides, sun, and water temps for the next few days:
  • Sunrise and sunset:
    • 5:49 AM sunrise. 
    • 7:59 PM sunset. 
  • Water temps are finally 70! And they'll stay that way as long as the NW wind doesn't blow and the sun stays out.
  • And tides are only an issue in the mornings:
    • -0.5' at sunrise
    • 3.7' at lunch
    • 2.5' late afternoon
    • And back to 4' at sunset
FORECAST:


Great surf the past couple weeks will be replaced by fun surf next week. A moderate storm off Antarctica a few days ago has sent more chest high S swell our way for late on Monday into Wedensday morning. The OC will see slightly bigger sets due to the S angle. After that, we could see more chest high SW swell return around the 21st. And no, the tropics aren't doing anything unfortunately. 

WEATHER:


Another inland heat wave is baking the deserts with 115 degree heat, 100 in E county, 90 along the 15 freeway, and high 70's at the coast. And Death Valley? Drum roll please... could see 131 degrees this weekend- the highest temperature ever recorded on earth. You heard it here first folks. And if you can't make it to the beach this weekend to cool off in the water, then make sure to hit your local wave pool if you got one. Skies should be partly sunny at the beaches once the fog slowly burns off. High pressure slowly erodes the 2nd half of next week for slightly cooler temperatures. If anything changes between now and then, make sure to follow North County Surf on Twitter!

BEST BET:
This weekend with fun chest high S swell or Tuesday with more fun chest high S swell. 

NEWS OF THE WEEK:


As we wait for hurricanes to kick into gear off Mainland Mexico, let's look back at some the Eastern Pacific's greatest hits:

The strongest tropical cyclones are ones that reach Category 5 intensity on the Saffir–Simpson hurricane scale. They are rare in the northeastern Pacific Ocean and generally form only once every several years. In general, Category 5s form in clusters in single years. Landfalls by such storms are rare due to the generally westerly path of tropical cyclones in the Northern Hemisphere. The term "hurricane" is used for tropical cyclones in the Pacific Ocean, north of the equator and east of the International Date Line. A Category 5 Pacific hurricane is therefore a tropical cyclone in the north Pacific Ocean that reached Category 5 intensity east of the International Date Line. 


The majority of tropical cyclones form and organize in areas of warm sea surface temperatures, usually of at least 26.5 °C (79.7 °F) and low vertical wind shear. When a pre-existing tropical disturbance – usually a tropical wave or a disturbance originating in the Intertropical Convergence Zone – enters an area where the aforementioned conditions are present, the disturbance can develop into a tropical cyclone, provided it is far enough from the equator to experience a sufficiently strong Coriolis force, which causes the counterclockwise rotation of hurricanes in the Northern Hemisphere. Between the months of December and April, sea surface temperatures in the tropics, where most Northeast Pacific tropical cyclones develop, are usually too low to support significant development. Also, the presence of a semi-permanent high-pressure area known as the North Pacific High in the eastern Pacific greatly reduces tropical cyclone development in the winter months, as the North Pacific High results in vertical wind shear that causes environmental conditions to be non-conducive to tropical cyclone formation. Another factor preventing tropical cyclones from forming during the winter is the presence of a semi-permanent low-pressure area called the Aleutian Low between January and April. Its effects in the central Pacific near the 160th meridian west cause tropical waves that form in the area to move northward into the Gulf of Alaska. As the disturbances travel northward, they dissipate or transition into an extratropical cyclone. The Aleutian Low's retreat in late-April allows the warmth of the Pacific High to meander in, bringing its powerful clockwise wind circulation with it. During the month of May, the Intertropical Convergence Zone migrates southward while vertical shear over the tropics decreases. As a result, the earliest tropical waves begin to form, coinciding with the start of the eastern Pacific hurricane season on May 15. During summer and early autumn, sea surface temperatures rise further, reaching 29 °C (84 °F) in July and August, well above the 26.5 °C (79.7 °F) threshold for the formation and intensification of tropical cyclones. This allows for tropical cyclones developing during that time to strengthen significantly, perhaps even rapidly.

El Niños also influence the frequency and intensity of hurricanes in the Northeast Pacific basin. (Unfortunately for us, this is not one of those years). During El Niño events, sea surface temperatures increase in the Northeast Pacific and vertical wind shear decreases. Because of this, an increase in tropical cyclone activity occurs; the opposite happens in the Atlantic basin during El Niño, where increased wind shear creates an unfavorable environment for tropical cyclone formation (like this year). Contrary to El Niño, La Niña events increase wind shear and decreases sea surface temperatures over the eastern Pacific, while reducing wind shear and increasing sea surface temperatures over the Atlantic.

A Category 5 hurricane is defined as having sustained windspeeds of at least 157 mph (253 km/h) over a one-minute period 10 m (32 ft 10 in) above the ground. As a tropical cyclone is moving, its wind field is asymmetric. In the northern hemisphere, the strongest winds are on the right side of the storm (relative to the direction of motion). The highest winds given in advisories are those from the right side.

Since the 1959 season, only 18 hurricanes are known to have reached Category 5 intensity (that's roughly once every 3 years). There are no known Category 5 storms occurring before 1959. It is possible that some earlier storms reached Category 5 over open waters, but they were never recognized because they never affected land and remained at sea.

The list below shows all Category 5 hurricanes in the order in which they formed. Only 1994's Hurricane Emilia and 2006's Hurricane Ioke have reached Category 5 intensity more than once; that is, by weakening into a Category 4 or weaker storm and later re-strengthening to a Category 5 storm (the gift that keeps on giving).


Before the advent of reliable geostationary satellite coverage in 1966, the number of eastern Pacific tropical cyclones was significantly underestimated. It is therefore very possible that there are additional Category 5 hurricanes other than those listed, but they were not reported and therefore not recognized. 

Hurricanes have reached Category 5 intensity during every month from June to October. The earliest Category 5 to form in a season is 1973's Hurricane Ava, which formed on June 7. The latest Category 5 to form in a season is Hurricane Kenna, which reached peak intensity on October 24. Hurricanes Ava, Gilma, Ioke, Linda, and Patricia are the most intense storms to form in their respective months. There have been no May, November, or off-season Category 5 hurricanes.

Two Pacific hurricanes are known to have reached Category 5 intensity multiple times: Emilia and Ioke. Both did it twice, and Ioke reached Category 5 status a third time as a typhoon while in the western Pacific. Hurricane Ioke was tied for the longest-lasting Category 5 hurricane recorded, spending 42 hours at that strength,mwhile hurricanes John and Linda had the longest time spent consecutively at that intensity.


Of all of the Category 5 Pacific hurricanes, the only ones to make landfall at any intensity were Hurricane Kenna, Hurricane Rick, Hurricane Patricia, and Hurricane Willa. None made landfall as Category 5 hurricanes; Patricia and Kenna had weakened to Category 4 status at the time of their landfalls, Willa had weakened to Category 3, and Rick was a tropical storm at its landfall. Patricia was the strongest at landfall among Pacific hurricanes; 1976's Hurricane Madeline and 1992's Hurricane Iniki are tied as the second-strongest storms at landfall, both of which did not reach Category 5 strength, but made landfall as stronger Category 4 storms than Kenna.

In addition to these four systems, hurricanes John, Linda, Ioke, Lane, and Walaka all threatened land at some point during their existence. John, Ioke and Walaka had minimal impacts on Johnston Atoll, John caused heavy surf in Hawaii, and Walaka passed close to East Island in the French Frigate Shoals. Linda was briefly forecast to approach southern California, and it passed close to Socorro Island near peak intensity. Out of the five aforementioned hurricanes, Lane had the most significant impact on land, threatening Hawaii as a major hurricane, and dropping more than 40" (1,000 mm) of rain across many areas. (For comparison's sake, San Diego gets roughly 10" of rain a year).


The reason for the lack of landfalls is that tropical cyclones in the northern hemisphere usually travel to the west. Within the Northeast Pacific, the easterly trade winds cause tropical cyclones to generally move westward out into the open Pacific Ocean. Only rarely do tropical cyclones forming during the peak months of the season make landfall. Closer to the end of the season, the subtropical ridge steers some storms northwards or northeastwards. Storms influenced by this ridge may bring impacts to the western coasts of Mexico and occasionally even Central America. In the central Pacific basin, the North Pacific High keeps tropical cyclones away from the Hawaiian Islands by forcing them southwards. Combined with cooler waters around the Hawaiian Islands that tend to weaken tropical cyclones that approach them, this makes direct impacts on the Hawaiian Islands by tropical cyclones rare.

PIC OF THE WEEK:


I got to surf this spot in Willy Wonka's Chocolate Factory. He calls it 'Skittles Point'. Taste the rainbow! 

Keep Surfing, 
Michael W. Glenn
Autocrat
I'm Batman
3rd Place, Gilligan's Island Pro, 1967

Thursday, July 1, 2021

THE Surf Report


2 Out Of 4 Ain't Bad!

SURF:
Summer is slowly creeping our way. I'm sure by they time we'll hit September, we'll be in full swing!


The past couple days saw 2 out of the 4 criteria I use for a classic summer day: Less wind and sun. For the Fourth of July weekend? I'm hoping for 2.5 or 3 out of 4. 


Small storms off Antarctica last week is sending fun SSW chest high surf our way for Friday and Saturday (good for 1 point). Water temps aren't consistently 70 degrees yet (no points there) and the coast may be partly sunny (another 0.5 points or a full point if entirely sunny), and the winds should be manageable (add 1 more point)! 


On its heels is a better storm for the Sunday to Tuesday timeframe with shoulder high surf. If the sun could just stay out this weekend at the beaches, I may just turn on the Emergency Boardriding System. It's all up to you Mr. Sun. And here's the tides, sun, and water temps for the next few days:
  • Sunrise and sunset:
    • 5:45 AM sunrise. 
    • 8:00 PM sunset. 
  • Water temps are hovering around the 68 degree mark. If the sun peaks through this weekend, you might be able to wear trunks and a jacket. If it doesn't- short sleeve full. We also had NW wind today (bad) but the sun was out early (good), so water temps will most likely stay 68 all weekend unless the winds back off and the sun stays out. 
  • And tides are only an issue in the evenings:
    • 3' at sunrise
    • 2' at lunch
    • 5' at dinner
    • And back to 3.5' at sunset
FORECAST:
As mentioned above, the fun SSW swell rolls into the beginning of the week with shoulder high sets through Tuesday. 


On its heels is a fairly impressive storm off New Zealand which is marching through the Pacific as we speak and will hit our shores later on Wednesday and lasting through the 2nd half of next week. Look for head high+ SW from it. And if the weather behaves, the EBS will be officially turned on. 


Models show more activity in the southern hemisphere for chest to shoulder high surf late next weekend.


As far as the tropics go, our water in the Eastern Pacific has been on the cool side and anything that forms off Mainland Mexico, fizzles before it hits Baja. Good for Cabo, bad for Cardiff. 

WEATHER:


Lots of hot weather in the western states- if your name isn't San Diego. Low clouds along the coast has moderated temps and sunshine with mild 75 degree temperatures. For the holiday weekend, looks to be more of the same. The only variable is if the sun comes out AND stays out. Let's just say that if we see partly sunny skies this weekend, I consider that a success. If anything changes between now and then, make sure to follow North County Surf on Twitter!

BEST BET:
Really fun SSW 4th of July and Tuesday- and GOOD SW the 2nd half of next week! 

NEWS OF THE WEEK:


Hot enough for ya? As you've heard by now, the western US is literally melting. Over a six-day period during the middle of June 2021, a dome of hot air languished over the western United States, causing temperatures to skyrocket. From June 15-20, all-time maximum temperature records fell at locations in seven different states (CA, AZ, NM, UT, CO, WY, MT). In Phoenix, Arizona, the high temperature was over 115 degrees for a record-setting six consecutive days, topping out at 118 degrees on June 17.

Not to be outdone, Tucson, Arizona, set daily record highs on six consecutive days from June 12-17, with June 15-16 tying for the fourth- and tenth-hottest days on record. The heat lasted from sun-up to sun-down: the temperature at 8 am on June 17 was 98 degrees in Tucson. But if you wanted to experience the hottest temperature anywhere in the country on June 17, then you had to head to Death Valley, where temperatures hit 128 degrees (let's just call it 130 for fun. That's incomprehensible).

The heat extended much farther than the Southwest. Salt Lake City, Utah, tied its all-time record when temperatures hit 107 degrees on June 15, the last day of a three-day streak of high temperatures over 100 degrees. From June 13-19, high temperatures averaged 100 degrees. Billings, Montana, also tied its all-time high of 108 degrees.


And the cherry on top? One of, if not the worst, heat wave in the region’s modern records impacted the Pacific Northwest of the United States and western Canada during late June 2021, not just breaking records but smashing them over an incredibly hot four-day period. And unlike the heat wave across the Southwest mentioned above, this time the dangerous heat was felt across a region not known for such extremes.

A week after a heatwave broke records across the Southwest and northern Mountain West, a second, even more anomalous, heatwave occurred across the Pacific Northwest and Western Canada. It sent records toppling. Over a four-day period, June 26-29, daytime high temperatures skyrocketed to well over 100 degrees Fahrenheit, setting all-time records at dozens of locations.

Portland, Oregon’s, average high temperature over this period was 112 degrees Fahrenheit, the hottest three-day period on record by an astonishing 6 degrees. All three days—108 on June 26, 112 on June 27, and 116 on June 28—set all-time heat records for the city. Seattle, Washington, also had back-to-back days that set all-time heat records: 108 on June 28 after reaching 104 the day prior. In fact, in the previous 126 years, Seattle had only hit 100 degrees three times. It reached that mark in three consecutive days in June!


The heat reached right to the coast, too, as Quillayute, Washington, on the Pacific Ocean reached an all-time record of 110 degrees Fahrenheit, a “mere” 45 degrees above-average, beating the previous record by a mind-boggling 11 degrees! The heat was so intense that roads buckled across the Northwest. 

And the heat didn’t stop at the US/Canada border. Western Canada also baked under an oppressive amount of heat. According to Environment Canada, Lytton, British Columbia reached 116 degrees Fahrenheit (46.1C) on June 27, setting a new all-time heat record for ALL OF CANADA! That record lasted for all of one day, as the temperature soared to 118 degrees (47.5C) on June 28. And THAT record lasted for all of one day as it reached a shocking 121 degrees (49.5C) on June 29. The previous all-time heat record for the entire country before this past weekend (113 degrees Fahrenheit or 45 degrees C) was broken by 8 degrees. Heck, according to Environment Canada, on June 29, six other locations also exceeded the previous all-time heat record for Canada.  To put this into perspective, the temperature in Lytton was hotter than has ever been recorded in Las Vegas, Nevada (117), except Lytton is located 1000 miles north, at 50 degrees north latitude. 

As with most questions about the atmosphere, there are multiple answers. The most direct cause of the blistering heat was a high-pressure system, stronger than ever observed in the region, that sat over the region for several days, unwilling to move like a stubborn dog on a walk. The cloudless skies and sinking air associated with the high pressure helped record temperatures build.

Adding to the heat in some locations was the prevailing winds, which in the Northern Hemisphere always blow clockwise around high pressure. Due to the topography of the region—mountains and high plateaus—easterly winds bring air from high elevation to lower elevations, which causes it to compress and heat up. These winds are called downslope winds, and they are known to kick temperatures up a notch all along the West Coast.


And finally, while there has not been an attribution study yet on this heat wave, climate change likely had an influence as well. As noted in the article on the previous record temperatures, heatwaves across the contiguous United States have occurred more often and lasted longer since the 1960s. According to NOAA’s Climate Extremes Index, the percent area of the Pacific Northwest that has experienced summertime extreme temperatures has drastically increased over the last twenty years. For the first 90 years of the record, an extreme heat footprint of larger than 50% of the area happened only three times. In the past 20 years, it has happened six times.

According to the 2018 National Climate Assessment, a scientific report by 13 U.S. federal agencies, heat waves have climbed from two per year in the 1960s to six per year by the 2010. The season for heat waves has also grown 45 days longer than it was in the 1960s, the report notes.

It is all part of an overall warming trend: The seven warmest years in the history of accurate worldwide record-keeping have been the last seven years, and 19 of the 20 warmest years have occurred since 2000. An analysis from the Copernicus Climate Change Service, a group of European climate researchers, found that the hottest year on record was 2020, tied with 2016. So we have that going for us. 

PIC OF THE WEEK:


There's a lady who's surfs all that glitters is cold,
And she's buying a stairway to heaven.
When she gets there she knows, if the shores are all closed,
With a board she can get what she came for.

Keep Surfing, 
Michael W. Glenn
Presentable
My Uncle's Name Is Sam
During My Years On The ASP, Rob Was The Bain Of My Existence