Thursday, January 27, 2022

THE Surf Report


It's Gonna Get Funky. 

SURF:
It's soooooo good to have surf around here again. 


Lots of WNW swells the past couple weeks AND nice weather has been a blessing from King Neptune. The swell from earlier in the week already peaked and will be smaller tomorrow- but still fun in the chest high range. 


For Saturday morning, the swell drops more to the waist high range but we will see a little bump in the afternoon/Sunday morning for inconsistent chest high sets again towards SD. The good news? Looks like mild to moderate Santa Ana winds on Friday morning to groom what's left of our swell. And here's the tides, sun, and water temps for the next few days:
  • Sunrise and sunset:
    • 6:45 AM sunrise
    • 5:19 PM sunset 
  • Water temps are holding in the high 50's. Still.
  • And big tide swings this weekend: 
    • 6.5' at sunrise
    • About -1.5' around 2 pm
    • Back up to 2' at sunset
FORECAST:

More swells are lined up on the horizon but the corresponding weather will be a little tricky. Models last showed a chance of rain- but have since backed off. In its wake though may be NW winds. Let's sort things out first: 


Monday should be small but Tuesday will see a bump from the SW from an off season SW. Look for waist high sets in SD and maybe stomach high+ in the OC? 


Late Tuesday into Wednesday sees increasing NW windswell for chest high surf in N County SD and shoulder high sets in SD. Conditions could be iffy due to the above mentioned winds though. 


After that, we're looking at small SW again around next Friday and more fun chest high+ WNW towards Sunday the 6th. Nothing big the next 10 days but fun at least- if the wind doesn't screw it up. 

WEATHER:


Looks like mild Santa Anas on tap tomorrow then cooler conditions over the weekend. As mentioned above, we've got some cold fronts moving inland behind us so no rain- but possibly NW winds Tuesday/Wednesday. After that, it's anyone's guess- but not rain. If anything changes between now and then, make sure to follow North County Surf on Twitter!

BEST BET:
Friday morning with leftover WNW and clean conditions. Tuesday/Wednesday looks to have combo swell but... NW winds? Or more combo swell next weekend. 

NEWS OF THE WEEK:


A fan favorite... THIS DAY IN WEATHER HISTORY! On a serious note, what's incredible about January 27th in weather history is that 3 significant events occurred- including big storms from the legendary '69 AND '83 El Nino's AND... 2 dams broke in SD County on this day in 1916! Glad we got by today unscathed...
  • 2008: Heavy rain hit the region and triggered several debris flows in the Poomacha and Witch Creek burn areas. Portions of highways 78 and 76 were closed.
  • 1983: A series of storms produced surf up to 16 feet from 1/22 to 1/29. Several piers collapsed. Damage was done to numerous businesses and homes. Several injuries occurred as people were swept off rocks.
  • 1969: Heavy rains of tropical origin began on 1/18 ended on 1/28. As much as 50 inches of rain fell at 7,700 feet. 31 inches of rain fell on the south slopes of Mt. San Gorgonio, 15.5 inches at San Jacinto Peak, around ten inches at Banning, less than 1 inch from Indio southeast. This day was the end of nine consecutive days (the most on record) of measurable precipitation in Riverside which started on 1/19. This also occurred on 2/13-2/21/1980. 91 were reported dead from flooding and mud slides all over California. Scores died in traffic accidents. Hundreds of homes and buildings were destroyed in slides, including 14 destroyed and 11 damaged homes in Mt. Baldy Village. 50 homes near Forest Home (Forest Falls) were damaged by flooding. Highways and railroads washed out. Power outages occurred. Cucamonga Creek itself caused $10 million in damage. The Mojave River took out numerous bridges and flooded farmlands in the upper desert. Strong storm winds felled trees which killed four and caused power outages.
  • 1956: A heavy storm in Southern California starting on 1/25 and ending on this day dropped 13.74 inches in Lake Arrowhead, 7.97 inches in LA, 7.27 inches in Santa Ana, 7.06 inches in San Bernardino, 4.00 inches in Riverside, 1.14 inches in San Diego, and 0.74 inch in Palm Springs. Around San Bernardino, local floods filled streets and channels, and blocked many roadways. Mud and rocks covered some roads, causing damage. This damage occurred after fires denuded nearby mountain slopes.
  • 1916: Heavy rain that began on 1/25 and ended on 1/30 exacerbated the flooding Sweetwater Dam after it failed due to excessive rainfall on this day in 1916. earlier in the month. Monthly rainfall totals for January 1916 ranged from 7.56 inches at San Diego to 57.91 inches at Dorman’s Ranch (in the San Bernardino Mountains, 2,500 feet elev.). Five inches fell in less than 12 hours in San Diego. Extensive flooding occurred all over Southern California,  the worst to date and it resulted in 28 total deaths in the region, 22 in San Diego County. This is the most destructive and deadly weather event in San Diego County History. The Lower Otay Dam broke sending a 40-foot wall of water downstream, killing 15. A few others drowned in Mission Valley and in the San Luis Rey River. The Sweetwater Dam also broke. Every large bridge in San Diego County but one was seriously damaged or destroyed. Four drowned in Orange County, two in a cottage floating down the Santa Ana River. Two drowned in San Bernardino County. Total damage was nearly $8 million (1916 dollars).
PIC OF THE WEEK:


Heaven on Earth. Period. 

Keep Surfing, 
Michael W. Glenn
Heavy-duty
Maxed Out My Diners Club Card
Gabriel's Replacement At Pipe

Thursday, January 20, 2022

THE Surf Report


Forget What I Said About December.

SURF:

I wasn't bad mouthing the month of December, was I? That must have been someone else. All the good surf in the month of January so far has changed my tune about this winter. The past is the past. Let bygones be bygones. 


Fun to good surf the past couple of weeks- along with good weather- has resulted in waves up and down the coast. Today was probably the smallest surf we've had the past two weeks but don't worry- more waves are on their way. 


For tomorrow, we get a slight bump from NW groundswell in the afternoon for chest high sets in N County SD and consistent chest high+ surf in S County SD by Saturday morning. Sunday is a touch smaller. Bonus to the small/fun swell on Saturday? Slight Santa Ana winds. Just enough to groom the surf and hopefully not enough for wildfire danger. And here's the tides, sun, and water temps for the next few days:
  • Sunrise and sunset:
    • 6:49 AM sunrise
    • 5:12 PM sunset 
    • And in case you were wondering, Daylight Saving Time doesn't happen until Sunday, March 13th. At that time, the sun will rise at 7 AM and set at 6:56 PM. Good for those evening sessions...
  • Water temps are holding in the high 50's. Still.
  • And tides are mellow this weekend: 
    • About 2' at sunrise
    • Just over 4' at noon
    • and down to 1' at sunset

FORECAST:

The batteries in the Emergency Boardriding System have about run out. BUT... there's still a little bit of the ol' Energizer Bunny in them. 


A good storm off the Aleutians today is sending solid WNW our way again for late Monday into Wednesday morning. Not as big as the good swell last week but still plenty of head high+ surf and good conditions. 


After that, we have a slow down for a few days, then it looks like a chest high WNW next Sunday the 30th. 


And then a very late season (or very early season depending on how you look at it) SW swell for waist high waves in SD and chest high sets in the OC. Models then show a slightly better storm forming for shoulder high WNW sets on maybe the first couple days of February. 


And THEN... really long range forecast charts show a solid WNW that could arrive around the 4th of February? Still a long way out so... forget I said that. For now. 

WEATHER:


I hate it when I make a funny little prediction- and it turns out to be not so funny. Like when I said last month "Isn't it funny that September was dry, October was wet, November was dry, December was wet, and I bet... January will be dry!" Gulp. So far no rain of significance this month and long range charts aren't showing any for the next 10 days either. So what does that mean for February? Build that ark you've been putting off! In the near term, great weather is in store for Friday with temps in the low 70's at the beaches and more of the same this weekend with a slight Santa Ana condition. For next week the models are flip flopping between cloudier conditions and nicer conditions- so let's just say we may see a return of slightly cooler temps and night/morning low clouds. If anything changes between now and then, make sure to follow North County Surf on Twitter!

BEST BET:

Saturday morning with a small but fun WNW and slight Santa Ana conditions. Or next Tuesday with solid WNW again. At which point the EBS will need new batteries. UNLESS... I hook it up to solar. Then early February should be good again. 

NEWS OF THE WEEK:


I don't know about you, but that blast in Tonga last week absolutely FLOORED me. It just put into perspective how small we are on this planet. And the smallest hiccup by our planet, the sun, etc. can have devastating consequences. Amazingly, that blast had been building for a few weeks prior to the main eruption. So what exactly happened? I'll let National Geographic explain:

Just a few weeks ago, a submarine volcano identifiable by two small uninhabitable islands in the Kingdom of Tonga began to erupt. Its outburst initially seemed innocuous, with ashen plumes and moderate explosions that few people living outside the archipelago noticed.

But this past weekend, that volcano, named Hunga Tonga-Hunga Ha'apai, forced the world to sit up and pay attention. After a moment of calm earlier this month, its eruptive activity turned increasingly violent. The middle section of the island vanished on satellite imagery. Towering columns of ash began to produce record-breaking amounts of lightning.

“The thing just went gangbusters,” says Chris Vagasky, meteorologist and lightning applications manager at the Finland-based weather measurements company Vaisala. “We were starting to get 5,000 or 6,000 events per minute. That’s a hundred events per second. It’s unbelievable.”

Then, early in the morning on January 15, the volcano produced a colossal explosion. The atmosphere was blasted out of the way as a shockwave emanated from the island, radiating outward at close to the speed of sound. The sonic boom was heard in parts of New Zealand more than 1,300 miles away, with the shockwave eventually traveling halfway around the world—as far as the United Kingdom, which is located a staggering 10,000 miles distant.

To everyone’s horror, a tsunami quickly followed. It hit Tongatapu, the kingdom’s main island and home to the capital Nuku'alofa, just a few dozen miles to the south of the volcano. Communications were knocked out as the streets began to flood and people fled for their lives. Tsunami waves, albeit smaller ones, rushed across the vast ocean to parts of the Pacific Northwest, causing surges in Alaska, Oregon, Washington State, and British Columbia. Stations in California, Mexico, and parts of South America also registered minor tsunami waves.

Recent research on the geologic history of the volcano suggests that this powerful paroxysm is, on human timescales, a relatively rare event: Such an explosion is thought to occur roughly once every thousand years. The hope is that the worst of the eruption is over. But even if that turns out to be the case, the damage has already been done.

Scientists and a rattled public are eager to know what caused such a powerful eruption, and what may happen next. But information has been slow to emerge partly because the volcano is somewhat remote and difficult to observe up close. “There are far more questions than answers at this point,” Krippner says. But here’s what scientists do know about the tectonic and geologic drivers involved, and what they might mean for the volcano’s future.

A VOLCANIC POWERHOUSE IN THE PACIFIC
Hunga Tonga-Hunga Ha'apai is located in region of the South Pacific that’s jam-packed with volcanoes—some above the waves, some far below—that have a penchant for violent eruptions. Past events have unleashed city-size rafts of pumice or seen volcanoes blowing themselves apart only to build new islands immediately afterward. 

This profusion of volcanoes exists because of the Pacific plate’s continuous dive beneath the Australian tectonic plate. As the slab descends into the superhot rocks of the mantle, the water inside gets baked out and rises into the mantle above. Adding water to these rocks causes them to more readily melt. This creates a lot of magma that tends to be sticky and filled with gas—a potent recipe for explosive eruptions.

Hunga Tonga-Hunga Ha'apai is no exception to this rule. The bits of land sit above a volcano more than 12 miles wide featuring a cauldron-like pit about three miles across, hidden from view by the sea. It’s been seen erupting with vim and vigor as far back as 1912, sometimes popping above the waves before being eroded away. The eruption of 2014-15 created a stable island that was soon home to colorful plants and barn owls.

When Hunga Tonga-Hunga Ha'apai started erupting again on December 19, 2021, it produced a series of blasts and an ash column 10 miles high, but it was doing “nothing out of the ordinary” for a submarine volcano, says Sam Mitchell, a volcanologist at the University of Bristol in the U.K. For the next few weeks, enough fresh lava erupted to expand the island by nearly 50 percent. And as the new year dawned, the volcano appeared to be calming down. Then, in the last couple of days, things took a turn for the dramatic.


THE VOLCANO’S MENACING MAELSTROM
As the volcano’s explosivity began to intensify, the amount of lightning emerging from its ashy plume began to eclipse not only that seen during this eruption, but during any eruption ever recorded.

Volcanoes can produce lightning because ash particles in their plumes bump into each other or into bits of ice in the atmosphere, which generates an electrical charge. Positive charges get segregated from negative ones, sparking a flash of lightning. (Learn more about how volcanoes can trigger lightning.)

During the first two weeks, lightening was recorded sometimes a few hundred or a few thousand flashes per day—nothing unusual. “It was clearing its throat, I guess,” says Vagasky. But by late Friday into early Saturday, the volcano was producing tens of thousands of discharges. At one point, this Tongan volcano managed 200,000 discharges in a single hour. By comparison, the 2018 eruption of Indonesia’s Anak Krakatau had 340,000 discharges over a week or so. “I couldn’t believe the numbers I was seeing,” says Vagasky. “You don’t usually see that with a volcano. This is something else. There was nowhere else that was that electric on the planet last night.”

It may have looked spectacular from afar, but up close it would have seemed apocalyptic, a constant blaze of light soundtracked by endless thunder and volcanic bellows. Most of the lightning wasn’t isolated to the plume but also hit the ground and the ocean. “This was extremely dangerous for anybody that’s sitting on any of the other Tongan islands, because you’ve got all this lightning coming down around you,” says Vagasky.

So why has this eruption produced what is likely to be a record-breaking number of discharges? The presence of water always ups the odds of lightning, says Kathleen McKee, a volcano acoustic researcher at the Los Alamos National Lab in New Mexico. When magma mingles with a shallow body of water, the trapped water is aggressively heated and vaporized, blasting that magma into millions of tiny pieces. The more plentiful and the finer the particles you have, the more lightning you generate.

The heat of the eruption also readily transports water vapor into the colder, higher reaches of the atmosphere, where it becomes ice, says Corrado Cimarelli, an experimental volcanologist at the Ludwig Maximilian University of Munich. That provides plenty of additional particles for the ash to collide with and generate electricity.


THE HEPHAESTION HAMMER FALLS
The astounding amount of lightning wasn’t the only prelude to the volcano’s cataclysmic blast. By Saturday morning, satellite imagery had revealed the island was no longer building itself: The middle of the volcanic isle had vanished, likely thanks to the uptick in explosivity.

When it eventually unleashed a giant explosion, the shockwave ricocheted across the globe at breakneck speeds. It was immediately followed by a tsunami that slammed into several islands in the Tongan archipelago before racing across the Pacific.

Jackie Caplan-Auerbach, a seismologist and volcanologist at Western Washington University in Bellingham, says the blast involved a “mind-boggling amount of energy.” But there isn’t enough data right now to ascertain the precise cause of the tsunami. These events require displacing a lot of water, which can happen through underwater explosions, through a collapse event—when lots of rock suddenly falls off the volcano into the sea—or a combination of these and other factors.

With the ash column obscuring the volcano, and much of the volcano submerged underwater, scientists will need time to gather more indirect data before drawing any conclusions. Clues could come from the types of acoustic waves the blast generated or perhaps the redistribution of mass around the volcano.

“The jury is still out,” Caplan-Auerbach says, but the fact that such an intense explosion and potent tsunami came out of this single, relatively small volcanic isle “speaks to the incredible power of this eruption.” And although not the cause of the main tsunami, the shockwave itself triggered another big wave: The rapidly moving air impacting the ocean was powerful enough to force water to move out of the way, a phenomenon called a meteotsunami.

Shane Cronin, a volcanologist at the University of Auckland in New Zealand, adds in a recent blog post that clues about why this event was so intense can be found in the volcano’s chemistry, which changes as the magmatic fuel within evolves over time.
This volcano, like many others, must refill its magma reservoir after a major eruption. The last of those in the region happened back in the year 1100; ever since, molten rock has been accumulating at depth. As it becomes mostly full, small amounts of magma leak out of the volcano, which is likely behind the eruptions recorded since 2009.

However, Cronin says, “once recharged, the large amount of magma crystallizing starts to drive gas pressures up, too quickly for it to be released by small eruptions.” Something’s got to give, and when that vast supply of magma finds an opening, it violently depressurizes and much of the molten reservoir is evacuated in one big blast.


A FOGGY FUTURE IN TONGA
The Tongan archipelago may owe its very existence to the infernal forces that constructed its islands in the first place, but it’s clear the cost of living on them can be steep. Only 100,000 people live in the kingdom, with about a quarter residing in the capital, and they are now besieged by ashfall and tsunami waves.
“The biggest unknown right now that really matters is we don’t know how the people in Tonga are,” Krippner says. This eruption, Mitchell adds, “could potentially be incredibly devastating to the country.”

So now comes the question everyone wants answered: “Is this eruption over?” Krippner says. “We don’t know.” Such a terrifying outburst may represent the effective decapitation the volcano’s shallow magma reservoir and the speedy exsanguination of its molten contents, Mitchell says. This eruption will be extensively studied by volcanologists, which will only improve their understanding of future events and bolster efforts to mitigate their effects. But it’s too soon to know for sure how things will unfold in the wake of this eruption. So for now, all eyes remain firmly fixed on Hunga Tonga-Hunga Ha'apai.
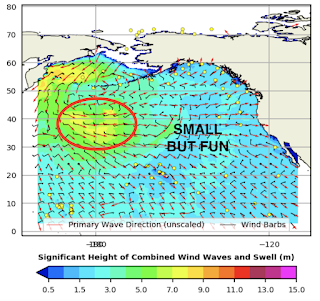
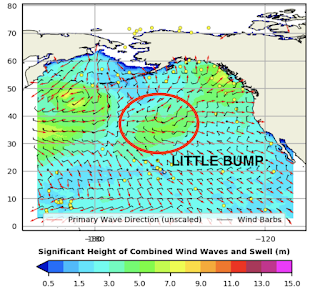
PIC OF THE WEEK:


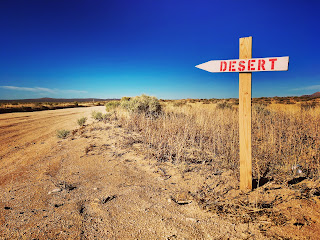
Think I'm finally going to do it- I'm going off the grid. Bought this little slice of heaven up on the bluff with a farm to keep me busy. I'm going to surf that little left until my little arms can't paddle no more. Just going to keep my iPhone of course- gotta have my sports scores. And maybe my Sprinter Van in case there's some surf up the coast. And while I'm at it, I sure hope there's a Walmart nearby- can't live without my Ding Dongs! So maybe not entirely off the grid- just enough to never hear the word Tik Tok again.

Keep Surfing, 
Michael W. Glenn
Undisputed
Already Using 6G On My iPhone 14
Only Verified Surfer To Get Barreled At San O' And Waikiki

Thursday, January 13, 2022

THE Surf Report


I'm Leaving The EBS On Until The Batteries Run Out

SURF:

It took awhile but we finally have good surf. Worth the wait? I sure say so. 


Firing WNW swell and clean conditions resulted in waves up and down the coast this past week. 


For tomorrow, we have another WNW filling in later in the day and peaking Saturday morning. Look for shoulder high surf in N County SD and head high waves at the best S County SD spots. Sunday is back to chest high sets. And here's the tides, sun, and water temps for the next few days:
  • Sunrise and sunset:
    • 6:51 AM sunrise
    • 5:06 PM sunset 
  • Water temps are holding in the high 50's
  • And good tides this weekend- something for everyone- high tides for beach breaks and low tides for reefs! 
    • 5' at sunrise
    • down to -0.5' mid-afternoon
    • and back up slightly to 1' at sunset
FORECAST:

Glad I replaced the batteries in the Emergency Boardriding System recently 'cause we're gonna need them in the near future. Nothing major in the short term but more good surf in the long term. 


First up is a small WNW on Tuesday for chest high surf


and another WNW for shoulder high surf again next weekend. 


Further out, we could see another overhead WNW around Monday the 24th 


and if the models are correct, a fun chest high SW swell around the 1st of February. Make sure to surf as much as you can 'cause who knows how long this will last. Then it's back to pickleball at the country club.

WEATHER:


Lots of clouds but no rain in sight (yet). Low pressure to the S of us is spinning up some cool looking tropical clouds above. That will sit there for the next few days. The low pressure will have to eventually come ashore and as it does, we may see some sprinkles (or a brief shower?!) on Monday. Don't expect anything measurable though. For the 2nd half of next week- nothing exciting- most likely sunny skies and cool temps. If anything changes between now and then, make sure to follow North County Surf on Twitter!

BEST BET:

Small but fun surf next week OR... better NW around the 24th. 

NEWS OF THE WEEK:


WE DID IT! 2021 didn't break the record for hottest year ever! But unfortunately, it still was the 4th warmest year on record. But look on the bright side? We didn't break the record either for billion dollar weather and climate disasters- we were 2nd with 18 in 2021 (2020 holds the record). So things are looking up? Here's more details from the National Oceanic and Atmospheric Administration:

For 2021, the average contiguous US temperature was 54.5°F, 2.5°F above the 20th-century average and ranked as the fourth-warmest year in the 127-year period of record. The six warmest years on record have all occurred since 2012. The December contiguous U.S. temperature was 39.3°F, 6.7°F above average and exceeded the previous record set in December 2015.

There were 20 separate billion dollar weather and climate disasters in 2021, just two events shy of the record set in 2020. These events caused at least 688 fatalities and scores more injured. Two disasters occurred in December — the Southeast, Central Tornado Outbreak and the Midwest Derecho and Tornado Outbreak.

The annual precipitation total for the contiguous U.S. was 30.48 inches, 0.54 inch above average, ranking in the middle third of the historical record. Despite near-normal precipitation at the national scale, 2021 witnessed several significant events at the regional scale, including an above-average monsoon season across the Southwest and several atmospheric river events along the Pacific Coast. Drought remained extensive across much of the western U.S. throughout 2021.


2021 Temperature Statistics:
  • Most of the contiguous U.S. experienced above-average temperatures during 2021. Maine and New Hampshire both had their second-warmest year on record with 19 additional states across the Northeast, Great Lakes, Plains and West experiencing a top-five year. Temperatures were near average for the year in pockets across the South and Gulf Coast states.
    • A cold-air outbreak across the central U.S. from February 10-19 brought frigid temperatures, snow, and ice from the Plains to southern Texas and into the Mississippi River Valley. It was the coldest event observed across the contiguous U.S. in more than 30 years and caused power outages for nearly 10 million people as well as other costly impacts across 15 states.
    • A record-warm June across the contiguous U.S. ended with an unprecedented heat wave across the Pacific Northwest. Approximately 14.6% of the contiguous U.S. observed its warmest June on record. This is the largest extent of record warm temperatures on record for the U.S. during June.
    • A record-warm December across the contiguous U.S. was punctuated by record-warm temperatures across10 states from the central Plains to the Gulf Coast. An additional 23 states from the Rockies to the East Coast ranked among their top-five Decembers.
  • The Alaskan statewide average annual temperature was 26.4°F, 0.4°F above the long-term average and was the coldest year since 2012. It was also the second year in a row with near-average annual statewide temperatures in contrast to the pronounced warmth across the state during 2014-2019. Despite the relatively mild year, Kodiak Harbor reported a temperature of 67°F on December 26. This is the highest December temperature on record for the entire state of Alaska, eclipsing the previous record of 65°F reported at Sitka Airport on December 12, 1944.

2021 Precipitation Statistics:
  • For the year as a whole, precipitation was above average in pockets from the Gulf Coast to the Great Lakes and into portions of the Northeast. Precipitation was below average across parts of the West, northern Rockies, Plains, western Great Lakes, Mid-Atlantic coast and parts of the Northeast and Florida.
    • A strong winter storm brought heavy snowfall to the central Rockies and High Plains March 13-14. Denver had its fourth-largest snowstorm on record while Cheyenne reported its heaviest multi-day storm on record. Blizzard conditions and heavy snowfall rates disrupted transportation throughout the region.
    • The Southwest monsoon season returned in July following two relatively inactive seasons. Tucson reported its wettest July and month on record followed by its wettest August on record. Consequently, flash flooding and fatalities resulting from the heavy rain were juxtaposed with the beneficial rainfall received from these events in the drought-stricken locations across the West and Southwest.
    • Several strong atmospheric river events from October to December along the West Coast brought ample rainfall and snow to several western states and mountain ranges. Drought intensity and coverage were reduced across some western states and end-of-year snowpack in the Sierra Nevada range broke December records, in excess of 200 percent of average at the end of the calendar year.
According to the US Drought Monitor (USDM), drought coverage for the contiguous U.S. remained fairly significant and steady throughout much of 2021 with a minimum extent of 43.4% occurring on May 25 and maximum coverage of 55.5% on Dec 7. Drought conditions remained intact for much of the western U.S. and northern to central High Plains throughout 2021 and blossomed along portions of the Lower Mississippi Valley and the Carolinas near the end of the year. Extreme (D3) and exceptional (D4) drought covered about 26.8 percent of the CONUS on August 17 — the largest extent of D3 and D4 drought in USDM history. Hawaii’s moderate (D1) to exceptional drought extent grew rapidly during the summer months, peaking at 59 percent in July and was most intense in November and early December with extreme and exceptional drought at nearly 11 percent coverage. Mid-December precipitation nearly eliminated drought across the islands by the end of the year. Drought across Puerto Rico ebbed and flowed throughout the year, peaking in November with 29 percent coverage; Alaska was nearly drought free during most of 2021. It was the wettest year since 2015 for the state of Alaska. Percentage of average precipitation received during 2021 varied by region with the West Coast region ranking wettest on record and the North Slope and interior regions receiving above-average precipitation. Meanwhile, parts of south-central Alaska and the Gulf regions received below-average precipitation for the year. Fairbanks had its wettest year on record with 18.74 inches of precipitation. This exceeded the previous record of 18.52 inches set in 1990.


Billion Dollar Disasters:
  • During 2021, 20 weather and climate disaster events had losses exceeding $1 billion each across the U.S. These events include eight severe weather events, four tropical cyclone events, three tornado outbreaks, two flooding events, one drought/heat wave event, one winter storm/cold wave event and one wildfire event, that includes the December 30 Marshall Fire in Boulder County, Colorado. This is the second-highest number of events on record and is two events shy of the 2020 annual record of 22 events.
  • The U.S. disaster costs for 2021 exceeded $145 billion, which is the third-highest cost on record. 
    • Hurricane Ida was the most costly event of the year ($75 billion) and ranks among the top-five most costly hurricanes on record (since 1980).
    • The historic mid-February winter storm/cold wave was the costliest winter storm on record ($24 billion) — in inflation-adjusted terms, twice as costly as the Storm of the Century in March 1993.
  • Disasters in 2021 have caused more than twice the number of fatalities than all the events that occurred in 2020 (688 versus 262) and were the highest in a decade for the contiguous U.S.
  • 2021 marks the seventh consecutive year (2015-2021) in which 10 or more separate billion-dollar disaster events have impacted the U.S.
  • Since records began in 1980, the U.S. has sustained 310 separate weather and climate disasters where overall damages/costs reached or exceeded $1 billion (based on the CPI adjustment to 2021) per event. The total cost of these 310 events exceeds $2.16 trillion. Disaster costs over the last five years (2017-2021) exceeded a record $742 billion, reflecting the increased exposure and vulnerability of the U.S. to extreme weather and climate events.

Other Notable Extremes:
  • During 2021, 21 named storms formed in the North Atlantic Basin. This was the third most-active Atlantic hurricane season on record. Above-average tropical activity across the Atlantic Basin occurred for the sixth year in a row. 
    • Category 4 Hurricane Sam formed during September and was the most intense Atlantic hurricane of the season. Sam maintained Category 4 strength for several days and remained far from land in the central Atlantic Ocean. 
    • On August 29, Category 4 Hurricane Ida made landfall in Louisiana and was the fifth-strongest landfalling hurricane to hit the contiguous U.S., and the second year in a row that a Category 4 hurricane hit Louisiana. More than 1 million residents, including all of New Orleans, were without power. Remnants of Ida merged with a frontal system and brought unprecedented rainfall, strong tornadoes and many fatalities to parts of the Northeast on September 1. Hurricane Ida was the strongest landfalling and most destructive hurricane of the season with end-of-year cost estimates at $7.5 billion.
  • It was an active wildfire year across the western U.S. with more than 7.1 million acres consumed, 96 percent of the 10-year average. 
    • The second-largest fire in California history, the Dixie Fire, consumed nearly 964,000 acres in 2021. 
    • Smoke from several large fires created air quality and health concerns across the West and contiguous U.S. throughout much of the season.
    • Wildfire activity across Alaska was below average and consumed approximately 253,000 acres in 2021 — only 22 percent of the 2011-2020 average. 
  • Snowfall during the 2020-2021 snow season was consistently below average across the Sierra Nevada range and parts of the northern Rockies. Several storm systems in January and the cold-air outbreak in February brought significant snowfall to the Lower 48. By February 16, snow covered 73.2 percent of the contiguous U.S — the highest daily value in the historical record. Additional late-season snowfall occurred in March, bringing record snowfall to portions of the central Rockies and High Plains and in April across the Ohio Valley and Northeast. 
  • The 2021 preliminary tornado count was above average across the contiguous U.S. with 1,376 tornadoes reported. 193 December tornadoes were confirmed by early January 2022 — the greatest number of tornadoes for any December on record and nearly twice the previous record of 97 in 2002.
    • The most notable events during the year include two outbreaks, with a combined total of about 100 tornadoes, including an EF-4 tornado, on March 17 and March 25 across Dixie Alley, an outbreak in Iowa on July 14, the December 10-11 Mid-Mississippi River Valley Tornado event that spawned two EF-4 tornadoes, and the December 15 Midwest derecho event that produced more than 60 tornadoes across Nebraska and Iowa — the most tornadoes confirmed on any day during 2021. No EF-5 tornadoes were reported during 2021. The most recent tornado classified as an EF-5 occurred in 2013.
    • Portions of the Northeast, including Pennsylvania, Delaware, New Jersey and New York, experienced a very active tornado season in 2021 with seven days of severe weather producing more than 30 tornadoes across the region.
    • The Mid-Mississippi River Valley experienced an historic severe weather event on December 10-11 — the Quad State Tornadoes — that produced two long-tracked EF-4 tornadoes across Arkansas, Missouri, Tennessee and Kentucky. The longest tornado track was nearly 166 miles across Kentucky and a small portion of Tennessee. This is a record length for the month of December, the longest-tracked tornado on record in Kentucky and the ninth-longest tornado track on record for the country. Damage estimates are ongoing and are in excess of $3.9 billion. 
  • The U.S. Climate Extremes Index (USCEI) for 2021 was 115 percent above average and ranked third highest in the 112-year record, second highest when taking the tropical cyclone indicator into consideration. Warm extremes in both maximum and minimum temperature across much of the U.S., in addition to dry Palmer Drought Severity Index values and extremes in 1-day precipitation across the U.S., contributed to this elevated USCEI value. The USCEI is an index that tracks extremes (falling in the upper or lower 10 percent of the record) in temperature, precipitation, drought and landfalling tropical cyclones across the contiguous U.S.
PIC OF THE WEEK:


Besides the tropical landscape, clear water, rivermouth sandbar point, empty line up, and a crossed up beach break at the far left of the cove, I really like that this little beach is protected from wind. It's the little things that count. 

Keep Surfing, 
Michael W. Glenn
Best Of The Best
Still Hoping The Chargers Can Make The Playoffs Somehow
The Queen Has Bestowed Upon Me The Title 'Knight Of The Round Tail'

Thursday, January 6, 2022

THE Surf Report


So Far So Good. Jinx!

SURF:

Felt good to get some waves finally. 


The NW that filled in late Tuesday held through today- and conditions were clean. 


For tomorrow, a weak low pressure system will move by to the N of us but it will send a WNW wind/groundswell combo to us late in the day. Look for more shoulder high surf with bigger sets towards SD on Saturday. Sunday will be a touch smaller but still chest high+ surf. And here's the tides, sun, and water temps for the next few days:
  • Sunrise and sunset:
    • 6:52 AM sunrise
    • 4:59 PM sunset (almost 5 PM!)
  • Water temps are holding in the high 50's
  • And compared to last weekend- the tides are mellow the next few days
    • around 2.5' at breakfast
    • up to 4' at lunch
    • and back down to 0' at sunset
FORECAST:


I think it's about time we turned on the Emergency Boardriding System again. Can you believe the last time I flipped the lever, it was at the end of October? THAT'S OVER 2 MONTHS AGO! That makes me sad. You know what makes me happy though? Surf. And firing surf at that. Models have a few solid swells lined up in the near future- so it's time to put the groveler back in the rafters and dust off that shortboard.


Monday starts off with leftover waist high+ NW then new good WNW fills in Tuesday. Look for head high+ surf late in the day and overhead sets Wednesday morning. 


Thursday drops back to head high sets but we get a couple more reinforcements from the WNW on Friday and Sunday for more shoulder to head high surf. If that's the case, we could have good waves for a week! Jinx! 


And if the forecast charts hold true, there may be a couple smaller WNW swells the third week of January for more chest (maybe shoulder) high sets. Positive thoughts everyone!

WEATHER:


If you haven't noticed, the past few months have been on again/off again for rain. September was dry, we got a surprise in October with a healthy 1" of rain, November was the driest ever with 0" of rain, and December we had over 3" of rain. So what does that mean for January? Dry so far of course! We have a weak cold front moving by to the N tomorrow which will give us more low clouds/fog and then we're due for beautiful weather again this weekend. Models show a low pressure system moving by to the S of us towards Tuesday next week- and potentially into Baja. If that's the case, we won't see any showers unfortunately. If anything changes between now and then, make sure to follow North County Surf on Twitter!

BEST BET:

Pretty much from late Friday until... not sure! Hopefully we'll have good surf for at least a week with the peak being Tuesday/Wednesday. 

NEWS OF THE WEEK:


As mentioned in THE Surf Report throughout 2021, North America is locked into a La Nina weather pattern for the foreseeable future. Normally we'd see below average rainfall and below average/less consistent surf. So far the below average/less consistent surf is holding true and rainfall totals are slightly above average for the time being. Let's cut to the chase though- when are we getting El Nino conditions again? Unfortunately, El Nino weather patterns can wreak havoc across the globe, but for us surfers here in Southern California, it's a blessing in disguise. Such as:
  • Above average rainfall in the winter to help our drought
  • Above average rainfall in the summer as tropical moisture gets pushed into our region from the Gulf of California
  • Above average water temps! 
  • Above average surf in the winter time as storms roll through Southern California- not pushed into the Pacific NW
  • And more hurricane surf in the summer! 
But first we need to get back to neutral conditions before El Nino happens. So when is that going to happen? Here's the National Oceanic and Atmospheric Administration on the latest conditions:


La Niña’s hallmark cooler-than-average ocean surface is readily apparent across much of the tropical Pacific. Over the past few weeks, cool anomalies have increased in the eastern Pacific, and in general we see a well-established La Niña pattern. Also characteristic of La Niña is the warmer-than-average surface temperatures in the far western Pacific.

The equatorial eastern Pacific is usually cooler than the water just to the north and south, and cooler than the water in the far western Pacific. (Scientists refer to this region as the “cold tongue,” unfortunately.) This cooler surface right along the equator is due to cold water upwelling from the deep ocean. Any time there is a temperature difference, or gradient, between cold and warm, nature wants to smooth it out, and tropical instability waves help to mix the cooler equatorial surface with the warmer off-equatorial water to the north and south.

During La Niña, the cold tongue is even colder (shudder), so we often see prominent tropical instability wave action. These waves move relatively quickly, so they usually don’t show up in monthly or seasonal sea surface temperature maps.

The sea surface temperature in the Niño-3.4 region of the tropical Pacific, our primary ENSO monitoring index, was about 0.9 °C cooler than the long-term (1991–2020) average. This is according to ERSSTv5, our most reliable dataset, and comfortably within the La Niña category of more than 0.5 °C cooler than average. Forecasters are confident that La Niña will continue for the next few months, partly based on computer model predictions. There is also a large pool of cooler-than-average water under the surface, adding confidence that La Niña’s demise is not imminent.


Forecasters think the most likely scenario is for La Niña to transition to neutral by the late spring. Neutral is the most common state for ENSO in the spring, and most computer models predict the Niño-3.4 Index to be in the neutral range (between -0.5 and 0.5 °C) by the April–June season.

We spend so much time and energy on El Niño and La Niña because they have a substantial impact on winter weather and climate around the globe. (Also, because they’re interesting!) La Niña shifts the Pacific jet stream, the fast-moving river of air that steers storms across North America. Specifically, during La Niña, the jet stream retracts to the west, and an area of high pressure tends to form in the north Pacific. These changes lead to a reduced number of storms coming onshore along the southwestern U.S. coast and hence drier conditions. On the other hand, the storm track tends to get deflected to the north, leading to wetter conditions in the Pacific Northwest.

Since La Niña is linked to drier conditions in the southern tier of the U.S., it can exacerbate drought. The current drought outlook does not expect relief for the severe drought in the Southwest this winter and is anticipating the expansion of drought eastward into Texas and Oklahoma.


Can we make any predictions about the state of ENSO for the winter of 2022–23? Not at the moment. Most of our computer models do not extend out that far, and the evolution from past La Niña events does not give us a clear picture. Overall, of the 12 first-year La Niñas in our historical record, four lasted only one year. Eight turned into double-dip La Niña, just like our current event. Of those, two recurred for a third year (triple-dip?). 

One interesting thing to note about La Niña 2020–22 is that, unlike the other 11, it did not follow a full-blown El Niño. The tropical Pacific was warmer than average in 2019–2020 but did not meet El Niño thresholds.

The likelihood of a double-dip La Niña increases for stronger preceding El Niños because the subsurface heat content in the equatorial band is usually more depleted following strong El Niños, providing extra inertia to sustain subsequent surface cooling over multi-year periods.  What then accounts for the current 2-year cold event, which was preceded by only very weak El Niño-like warming, is an interesting research topic.

And so, as much as we’d like to get an idea of the next winter, it’s still too soon. The minute forecasters have a clearer picture, though, we’ll pass it on to you!

PIC OF THE WEEK:


Nova Scotia doing its best impression of a cold water Macaronis. 

Keep Surfing, 
Michael W. Glenn
Sharp As A Tack
Got The Ikon Pass, Disney's Fast Pass, And Taco Bell's Taco Lovers Pass
Guinness Record Holder For Deepest In And Out Barrel @ 38.5' Behind The Lip