I'm Leaving The EBS On Until The Batteries Run Out
SURF:
It took awhile but we finally have good surf. Worth the wait? I sure say so.
Firing WNW swell and clean conditions resulted in waves up and down the coast this past week.
For tomorrow, we have another WNW filling in later in the day and peaking Saturday morning. Look for shoulder high surf in N County SD and head high waves at the best S County SD spots. Sunday is back to chest high sets. And here's the tides, sun, and water temps for the next few days:
- Sunrise and sunset:
- 6:51 AM sunrise
- 5:06 PM sunset
- Water temps are holding in the high 50's
- And good tides this weekend- something for everyone- high tides for beach breaks and low tides for reefs!
- 5' at sunrise
- down to -0.5' mid-afternoon
- and back up slightly to 1' at sunset
FORECAST:
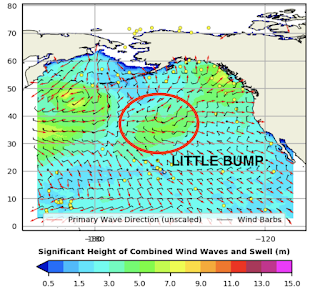
Glad I replaced the batteries in the Emergency Boardriding System recently 'cause we're gonna need them in the near future. Nothing major in the short term but more good surf in the long term.
First up is a small WNW on Tuesday for chest high surf
and another WNW for shoulder high surf again next weekend.
Further out, we could see another overhead WNW around Monday the 24th
and if the models are correct, a fun chest high SW swell around the 1st of February. Make sure to surf as much as you can 'cause who knows how long this will last. Then it's back to pickleball at the country club.
WEATHER:
Lots of clouds but no rain in sight (yet). Low pressure to the S of us is spinning up some cool looking tropical clouds above. That will sit there for the next few days. The low pressure will have to eventually come ashore and as it does, we may see some sprinkles (or a brief shower?!) on Monday. Don't expect anything measurable though. For the 2nd half of next week- nothing exciting- most likely sunny skies and cool temps. If anything changes between now and then, make sure to follow North County Surf on Twitter!
BEST BET:
Small but fun surf next week OR... better NW around the 24th.
NEWS OF THE WEEK:
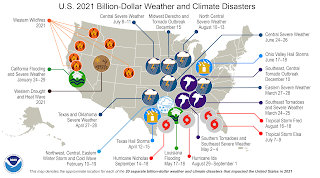
WE DID IT! 2021 didn't break the record for hottest year ever! But unfortunately, it still was the 4th warmest year on record. But look on the bright side? We didn't break the record either for billion dollar weather and climate disasters- we were 2nd with 18 in 2021 (2020 holds the record). So things are looking up? Here's more details from the National Oceanic and Atmospheric Administration:
For 2021, the average contiguous US temperature was 54.5°F, 2.5°F above the 20th-century average and ranked as the fourth-warmest year in the 127-year period of record. The six warmest years on record have all occurred since 2012. The December contiguous U.S. temperature was 39.3°F, 6.7°F above average and exceeded the previous record set in December 2015.
For 2021, the average contiguous US temperature was 54.5°F, 2.5°F above the 20th-century average and ranked as the fourth-warmest year in the 127-year period of record. The six warmest years on record have all occurred since 2012. The December contiguous U.S. temperature was 39.3°F, 6.7°F above average and exceeded the previous record set in December 2015.
There were 20 separate billion dollar weather and climate disasters in 2021, just two events shy of the record set in 2020. These events caused at least 688 fatalities and scores more injured. Two disasters occurred in December — the Southeast, Central Tornado Outbreak and the Midwest Derecho and Tornado Outbreak.
The annual precipitation total for the contiguous U.S. was 30.48 inches, 0.54 inch above average, ranking in the middle third of the historical record. Despite near-normal precipitation at the national scale, 2021 witnessed several significant events at the regional scale, including an above-average monsoon season across the Southwest and several atmospheric river events along the Pacific Coast. Drought remained extensive across much of the western U.S. throughout 2021.
2021 Temperature Statistics:
2021 Precipitation Statistics:
- Most of the contiguous U.S. experienced above-average temperatures during 2021. Maine and New Hampshire both had their second-warmest year on record with 19 additional states across the Northeast, Great Lakes, Plains and West experiencing a top-five year. Temperatures were near average for the year in pockets across the South and Gulf Coast states.
- A cold-air outbreak across the central U.S. from February 10-19 brought frigid temperatures, snow, and ice from the Plains to southern Texas and into the Mississippi River Valley. It was the coldest event observed across the contiguous U.S. in more than 30 years and caused power outages for nearly 10 million people as well as other costly impacts across 15 states.
- A record-warm June across the contiguous U.S. ended with an unprecedented heat wave across the Pacific Northwest. Approximately 14.6% of the contiguous U.S. observed its warmest June on record. This is the largest extent of record warm temperatures on record for the U.S. during June.
- A record-warm December across the contiguous U.S. was punctuated by record-warm temperatures across10 states from the central Plains to the Gulf Coast. An additional 23 states from the Rockies to the East Coast ranked among their top-five Decembers.
- The Alaskan statewide average annual temperature was 26.4°F, 0.4°F above the long-term average and was the coldest year since 2012. It was also the second year in a row with near-average annual statewide temperatures in contrast to the pronounced warmth across the state during 2014-2019. Despite the relatively mild year, Kodiak Harbor reported a temperature of 67°F on December 26. This is the highest December temperature on record for the entire state of Alaska, eclipsing the previous record of 65°F reported at Sitka Airport on December 12, 1944.
- For the year as a whole, precipitation was above average in pockets from the Gulf Coast to the Great Lakes and into portions of the Northeast. Precipitation was below average across parts of the West, northern Rockies, Plains, western Great Lakes, Mid-Atlantic coast and parts of the Northeast and Florida.
- A strong winter storm brought heavy snowfall to the central Rockies and High Plains March 13-14. Denver had its fourth-largest snowstorm on record while Cheyenne reported its heaviest multi-day storm on record. Blizzard conditions and heavy snowfall rates disrupted transportation throughout the region.
- The Southwest monsoon season returned in July following two relatively inactive seasons. Tucson reported its wettest July and month on record followed by its wettest August on record. Consequently, flash flooding and fatalities resulting from the heavy rain were juxtaposed with the beneficial rainfall received from these events in the drought-stricken locations across the West and Southwest.
- Several strong atmospheric river events from October to December along the West Coast brought ample rainfall and snow to several western states and mountain ranges. Drought intensity and coverage were reduced across some western states and end-of-year snowpack in the Sierra Nevada range broke December records, in excess of 200 percent of average at the end of the calendar year.
Billion Dollar Disasters:
- During 2021, 20 weather and climate disaster events had losses exceeding $1 billion each across the U.S. These events include eight severe weather events, four tropical cyclone events, three tornado outbreaks, two flooding events, one drought/heat wave event, one winter storm/cold wave event and one wildfire event, that includes the December 30 Marshall Fire in Boulder County, Colorado. This is the second-highest number of events on record and is two events shy of the 2020 annual record of 22 events.
- The U.S. disaster costs for 2021 exceeded $145 billion, which is the third-highest cost on record.
- Hurricane Ida was the most costly event of the year ($75 billion) and ranks among the top-five most costly hurricanes on record (since 1980).
- The historic mid-February winter storm/cold wave was the costliest winter storm on record ($24 billion) — in inflation-adjusted terms, twice as costly as the Storm of the Century in March 1993.
- Disasters in 2021 have caused more than twice the number of fatalities than all the events that occurred in 2020 (688 versus 262) and were the highest in a decade for the contiguous U.S.
- 2021 marks the seventh consecutive year (2015-2021) in which 10 or more separate billion-dollar disaster events have impacted the U.S.
- Since records began in 1980, the U.S. has sustained 310 separate weather and climate disasters where overall damages/costs reached or exceeded $1 billion (based on the CPI adjustment to 2021) per event. The total cost of these 310 events exceeds $2.16 trillion. Disaster costs over the last five years (2017-2021) exceeded a record $742 billion, reflecting the increased exposure and vulnerability of the U.S. to extreme weather and climate events.
- During 2021, 21 named storms formed in the North Atlantic Basin. This was the third most-active Atlantic hurricane season on record. Above-average tropical activity across the Atlantic Basin occurred for the sixth year in a row.
- Category 4 Hurricane Sam formed during September and was the most intense Atlantic hurricane of the season. Sam maintained Category 4 strength for several days and remained far from land in the central Atlantic Ocean.
- On August 29, Category 4 Hurricane Ida made landfall in Louisiana and was the fifth-strongest landfalling hurricane to hit the contiguous U.S., and the second year in a row that a Category 4 hurricane hit Louisiana. More than 1 million residents, including all of New Orleans, were without power. Remnants of Ida merged with a frontal system and brought unprecedented rainfall, strong tornadoes and many fatalities to parts of the Northeast on September 1. Hurricane Ida was the strongest landfalling and most destructive hurricane of the season with end-of-year cost estimates at $7.5 billion.
- It was an active wildfire year across the western U.S. with more than 7.1 million acres consumed, 96 percent of the 10-year average.
- The second-largest fire in California history, the Dixie Fire, consumed nearly 964,000 acres in 2021.
- Smoke from several large fires created air quality and health concerns across the West and contiguous U.S. throughout much of the season.
- Wildfire activity across Alaska was below average and consumed approximately 253,000 acres in 2021 — only 22 percent of the 2011-2020 average.
- Snowfall during the 2020-2021 snow season was consistently below average across the Sierra Nevada range and parts of the northern Rockies. Several storm systems in January and the cold-air outbreak in February brought significant snowfall to the Lower 48. By February 16, snow covered 73.2 percent of the contiguous U.S — the highest daily value in the historical record. Additional late-season snowfall occurred in March, bringing record snowfall to portions of the central Rockies and High Plains and in April across the Ohio Valley and Northeast.
- The 2021 preliminary tornado count was above average across the contiguous U.S. with 1,376 tornadoes reported. 193 December tornadoes were confirmed by early January 2022 — the greatest number of tornadoes for any December on record and nearly twice the previous record of 97 in 2002.
- The most notable events during the year include two outbreaks, with a combined total of about 100 tornadoes, including an EF-4 tornado, on March 17 and March 25 across Dixie Alley, an outbreak in Iowa on July 14, the December 10-11 Mid-Mississippi River Valley Tornado event that spawned two EF-4 tornadoes, and the December 15 Midwest derecho event that produced more than 60 tornadoes across Nebraska and Iowa — the most tornadoes confirmed on any day during 2021. No EF-5 tornadoes were reported during 2021. The most recent tornado classified as an EF-5 occurred in 2013.
- Portions of the Northeast, including Pennsylvania, Delaware, New Jersey and New York, experienced a very active tornado season in 2021 with seven days of severe weather producing more than 30 tornadoes across the region.
- The Mid-Mississippi River Valley experienced an historic severe weather event on December 10-11 — the Quad State Tornadoes — that produced two long-tracked EF-4 tornadoes across Arkansas, Missouri, Tennessee and Kentucky. The longest tornado track was nearly 166 miles across Kentucky and a small portion of Tennessee. This is a record length for the month of December, the longest-tracked tornado on record in Kentucky and the ninth-longest tornado track on record for the country. Damage estimates are ongoing and are in excess of $3.9 billion.
- The U.S. Climate Extremes Index (USCEI) for 2021 was 115 percent above average and ranked third highest in the 112-year record, second highest when taking the tropical cyclone indicator into consideration. Warm extremes in both maximum and minimum temperature across much of the U.S., in addition to dry Palmer Drought Severity Index values and extremes in 1-day precipitation across the U.S., contributed to this elevated USCEI value. The USCEI is an index that tracks extremes (falling in the upper or lower 10 percent of the record) in temperature, precipitation, drought and landfalling tropical cyclones across the contiguous U.S.
PIC OF THE WEEK:
Besides the tropical landscape, clear water, rivermouth sandbar point, empty line up, and a crossed up beach break at the far left of the cove, I really like that this little beach is protected from wind. It's the little things that count.
Keep Surfing,
Michael W. Glenn
Best Of The Best
Still Hoping The Chargers Can Make The Playoffs Somehow
The Queen Has Bestowed Upon Me The Title 'Knight Of The Round Tail'
Michael W. Glenn
Best Of The Best
Still Hoping The Chargers Can Make The Playoffs Somehow
The Queen Has Bestowed Upon Me The Title 'Knight Of The Round Tail'


